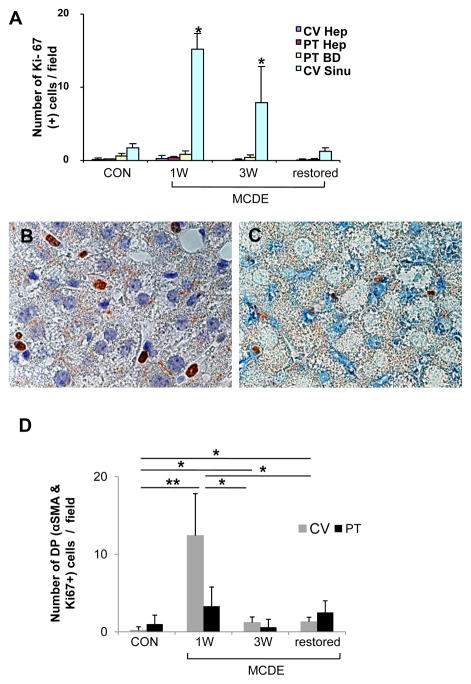
Figure 5. Ki-67 expression in the livers of TG mice.
GFAP-Cre/GFP mice (n = 15) were fed MCDE-diets and survivors were sacrificed as described above (n = 4/group/time point). Immunohistochemistry for Ki-67 or double-immunohistochemistry for Ki-67/αSMA was performed. Numbers of Ki-67-positive cells visualized at X63 (high power) were counted in different parts of the liver lobule (i.e., near central veins (CV) and portal tracts (PT)) and in different cell types (i.e., hepatocytes (Hep), bile ductular cells (BD), and perisinuosoidal lining cells (Sinu)). Results are graphed as numbers of positive cells/field in (A).* p < 0.05 Ki-67 expression (B) and Ki-67 and αSMA co-expression (C) in mice that were sacrificed at the end of 1 week MCDE treatment. Numbers of double positive (DP) cells for Ki-67and αSMA in different areas of the liver lobule (CV or PT) were counted at different time points and results are graphed in (D). * p < 0.05, ** p < 0.005 (A, C magnification X100)

