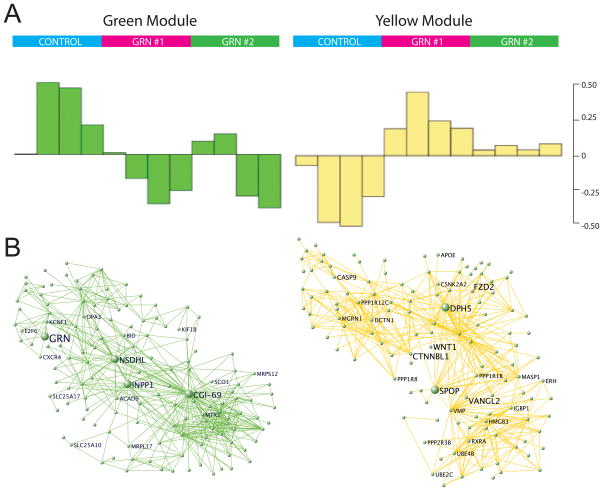
Figure 4.
WGCNA Analysis of GRN deficiency in cell culture. WGCNA analysis (see Methods) was carried out on the cell-culture data, and we chose to focus on two modules of importance: one containing GRN, and on another that is most correlated with GRN knockdown samples. A. Module eigengenes (ME) are computed from the first principle component of the gene expression data to summarize the major trend in gene expression within each module. Samples are plotted along the x-axis where each bar represents one sample, and the value of the ME for each sample is displayed on the y-axis. These plots show that these two modules are specific to the samples containing GRN knockdown. Genes in the green module are generally upregulated with GRN loss, whereas genes in the yellow module are downregulated. B. The strongest connections based on topological overlap are plotted for ease of analysis. This allows for easy visualization of highly connected genes within each module. See also figure S6 and tables S3 and S4.

