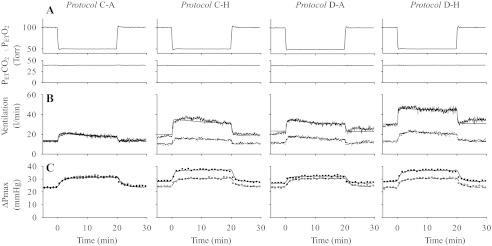
Fig. 1.

Mean values for A: end-tidal Po2 (PetO2) and end-tidal Pco2 (PetCO2) (15-s averages), B: ventilation (15-s averages), and C: maximum systolic pressure difference across the tricuspid valve during systole (ΔPmax) in the morning (AM measurements, open symbols or broken lines) and afternoon (PM measurements, closed symbols or continuous lines) in all four protocols. Lines through data for ventilation and ΔPmax indicate the fit of the relevant models to the data.
