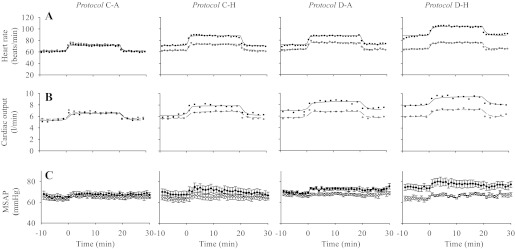
Fig. 2.

Mean values for heart rate (A), cardiac output (B), and mean systemic arterial blood pressure (C, mean ± SE) in the morning (AM measurements, open symbols or broken lines) and afternoon (PM measurements, closed symbols or continuous lines) in all four protocols. Lines through data for HR or CO indicate the fit of the cardiovascular model to the data.
