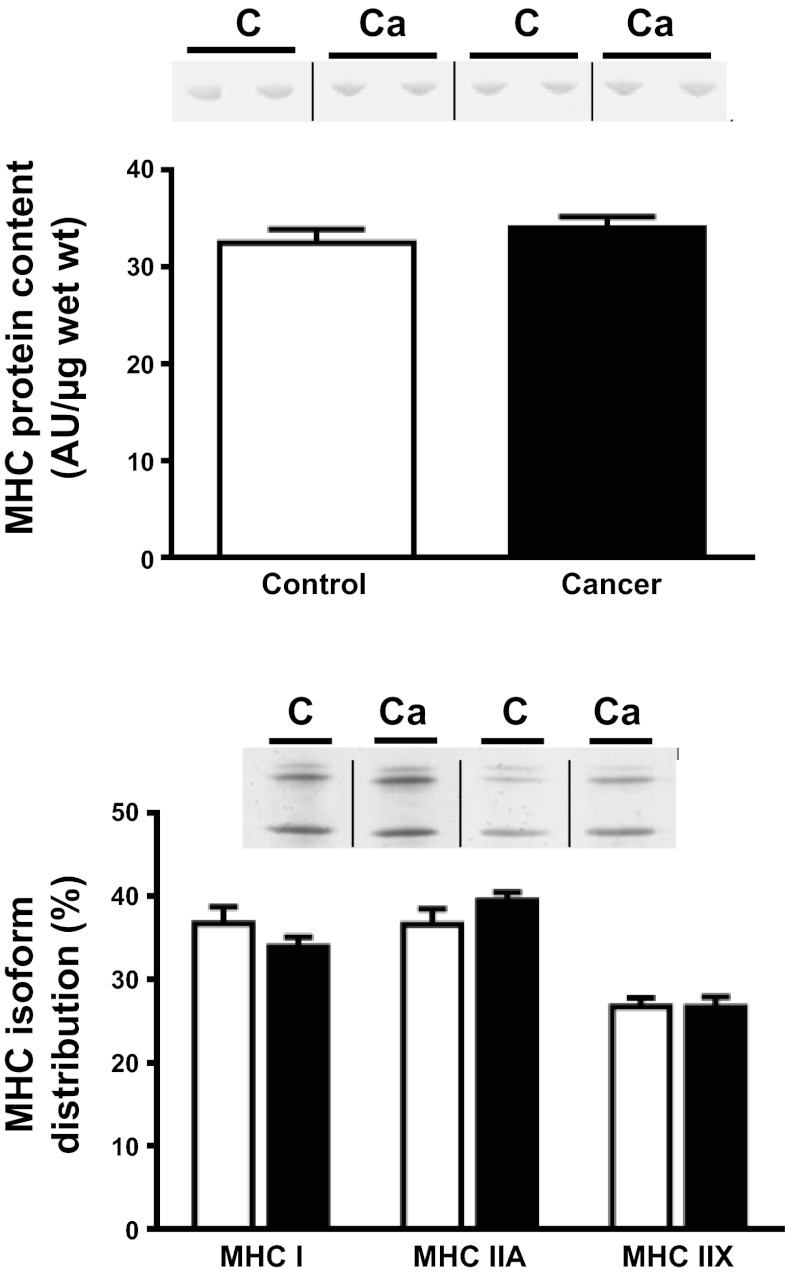
Fig. 3.
Skeletal muscle tissue homogenate myosin protein content and isoform distribution in controls (n = 6) and patients with cancer (n = 10). Representative gel images of bands for controls (C) and patients with cancer (Ca) are shown, with black lines demarcating where intervening lanes have been spliced out. Data are mean ± SE.

