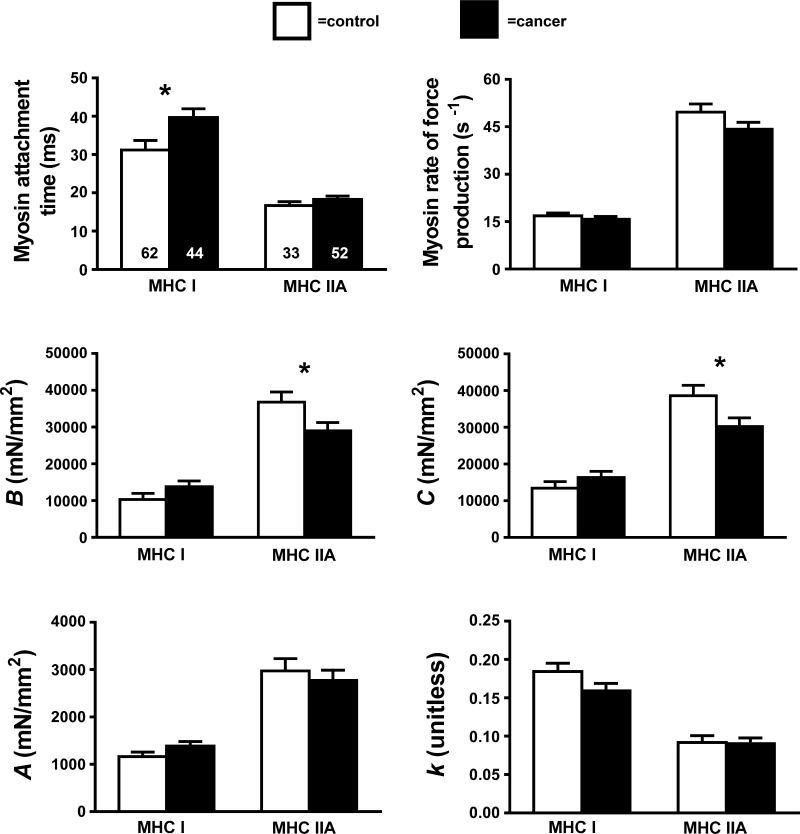
Fig. 6.
Sinusoidal analysis model parameters for maximal Ca2+-activated (pCa 4.5) MHC I and IIA fibers in controls (n = 6) and patients with cancer (n = 8). The number of fibers studied is shown at the base of each bar on the panel showing myosin attachment time. Definitions for each variable are provided in Methods. *P < 0.05.

