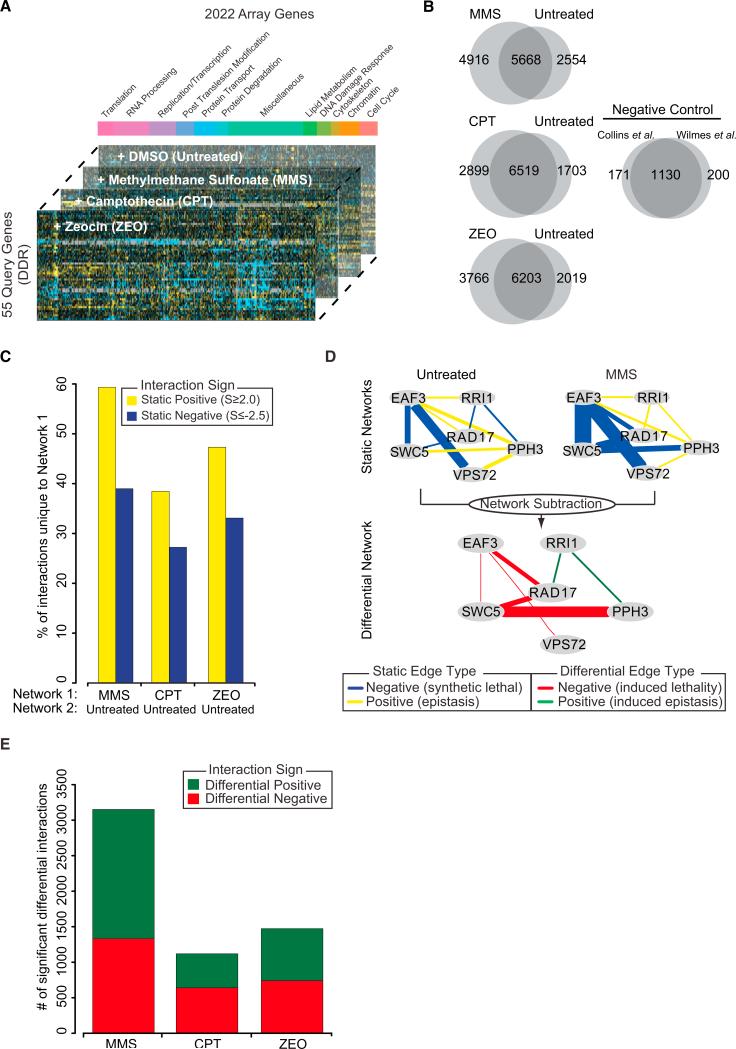
Figure 1. Overview of the Multionditional Differential Network.
(A) Design of the differential genetic interaction screen. The stacked bar plot illustrates the functional breakdown of array genes.
(B) Overlap in static interactions (S ≥ 2.0, S ≤ –2.5) between treated and untreated conditions. The negative control represents the overlap between previously published networks measured in untreated conditions.
(C) The percentage of positive and negative interactions unique to the treated network (Network 1) when compared to the untreated network (Network 2).
(D) Schematic overview of how differential networks are derived by examining the difference between static treated and untreated genetic networks. The thickness of the edge scales with the magnitude of the genetic interaction.
(E) Number of significant positive and negative differential interactions uncovered in each condition.

