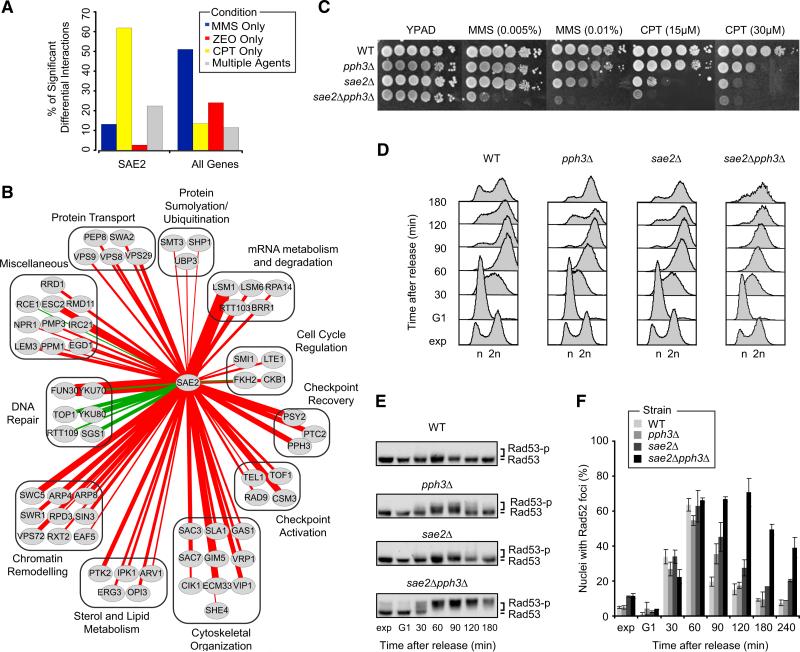
Figure 3. Sae2 and Pph3 Cooperate in DNA Repair and Checkpoint Recovery.
(A) Percentage of SAE2's significant differential interactions in response to MMS, CPT, ZEO, or multiple agents. As a control, the average percentage of significant differential interactions in each category across all genes is shown.
(B) Network of all 64 significant positive (green edges) or negative (red edges) differential interactions with SAE2 in response to CPT. Thickness of the edge scales with significance of the interaction.
(C) Serial dilutions (10-fold) of cells were grown on YPAD + MMS or CPT.
(D) Cells were arrested in G1 and transiently exposed to MMS (30 min, 0.02% MMS), then released in fresh medium and analyzed by FACS at the indicated time points.
(E) Western blot analysis of Rad53 phosphorylation in cells from (D).
(F) As in (D), except that cells expressing Rad52-YFP were used. Images were taken at the indicated time points and scored for Rad52-YFP foci. At least 100 nuclei were analyzed per strain and per time point. Data represent the mean ± 1 SD from three independent experiments.
See also Figure S3.

