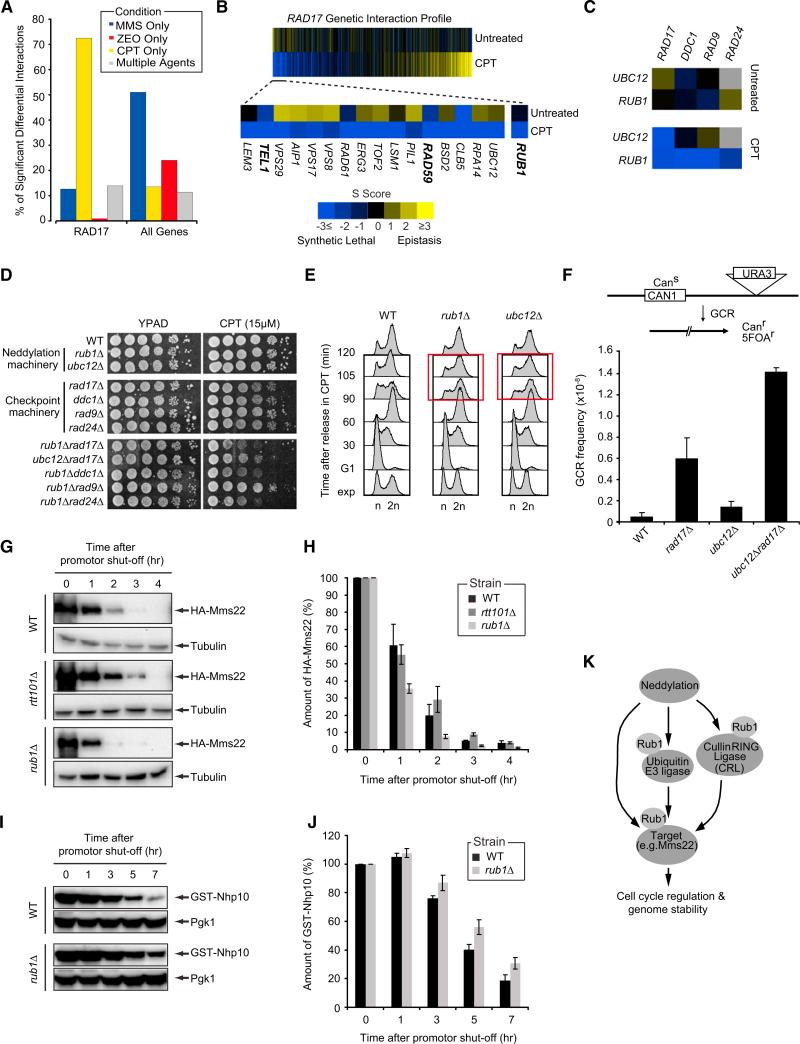
Figure 4. Neddylation Regulates Cell-Cycle Progression after DNA Damage and Preserves Genome Integrity.
(A) Percentage of RAD17's significant differential genetic interactions in response to MMS, CPT, ZEO, or multiple agents.
(B) CPT-induced genetic interaction profile for RAD17 sorted (left to right) in order of most differential negative to most differential positive. A subset of the top differential negative interactions is also shown.
(C) Genetic interactions between components of neddylation and DNA damage checkpoint pathways.
(D) Serial dilutions (10-fold) of cells were grown on YPAD + CPT.
(E) Cells were arrested in G1, released in medium + 50 μM CPT and analyzed by FACS at the indicated time points.
(F) GCR frequencies were determined as described in the Experimental Procedures.
(G) GAL1-HA-Mms22 expression was induced for 3 hr in medium + galactose. Cells were released in glucose to shut off expression after which HA-Mms22 levels were monitored by western blot analysis.
(H) Bar plot showing the rate of HA-Mms22 protein degradation in cells from (G). HA-Mms22 protein levels were quantified and normalized to tubulin. The ratio at the start of shutoff was set to 100%.
(I) As in (G), except that GAL1-GST-Nhp10 expression was monitored.
(J) As in (H), except that GST-Nhp10 levels were quantified and normalized to Pgk1.
(K) Schematic illustrating proposed mechanisms by which neddylation regulates cell-cycle progression and genome stability. See the main text for details.
All data represent the mean ± 1 SD deviation of at least three independent experiments. See also Figure S4.

