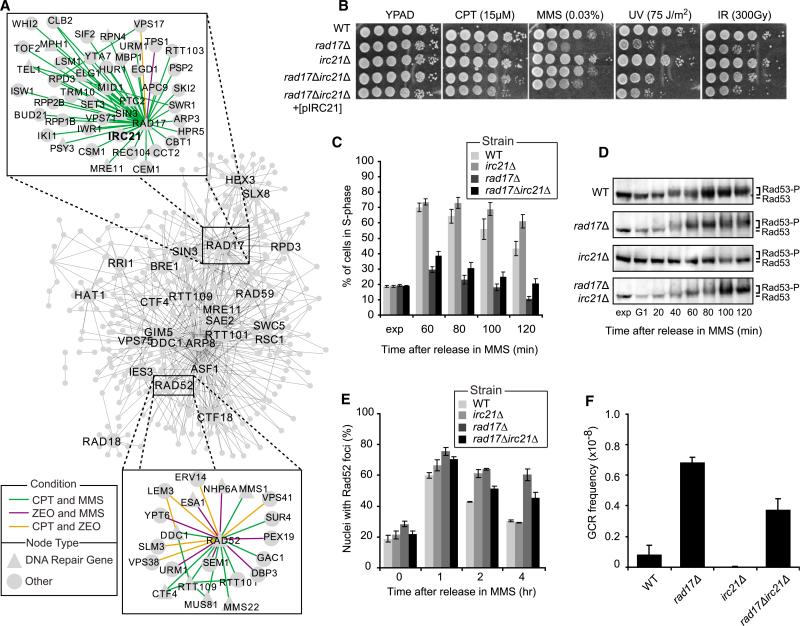
Figure 5. Irc21 Affects Checkpoint Control, DNA Repair, and Genome Stability.
(A) Network of all 584 differential genetic interactions induced by at least two agents. The top 25 hubs in this network are labeled. The subnetworks of interactions involving RAD17 and RAD52 are also shown.
(B) Serial dilutions (10-fold) of cells of the indicated genotypes were grown on YPAD + MMS or CPT, or on YPAD after exposure to UV or IR.
(C) Exponentially (exp) growing cells were arrested in G1, released in medium + 0.02% MMS and 15 μg/ml nocodazole and analyzed by FACS at the indicated time points (see Figure S5E for FACS plots). The bar plot shows the percentage of S phase cells.
(D) Western blot analysis of Rad53 phosphorylation in cells from (C).
(E) Exponentially growing cells expressing Rad52-YFP were exposed to 0.02% MMS for 1 hr and released in fresh medium. Images were taken at the indicated time points and scored for Rad52-YFP foci. At least 100 nuclei were analyzed per strain and per time point.
(F) GCR frequencies were determined as in Figure 4F.
All data represent the mean ± 1 SD from three independent experiments. See also Figure S5.

