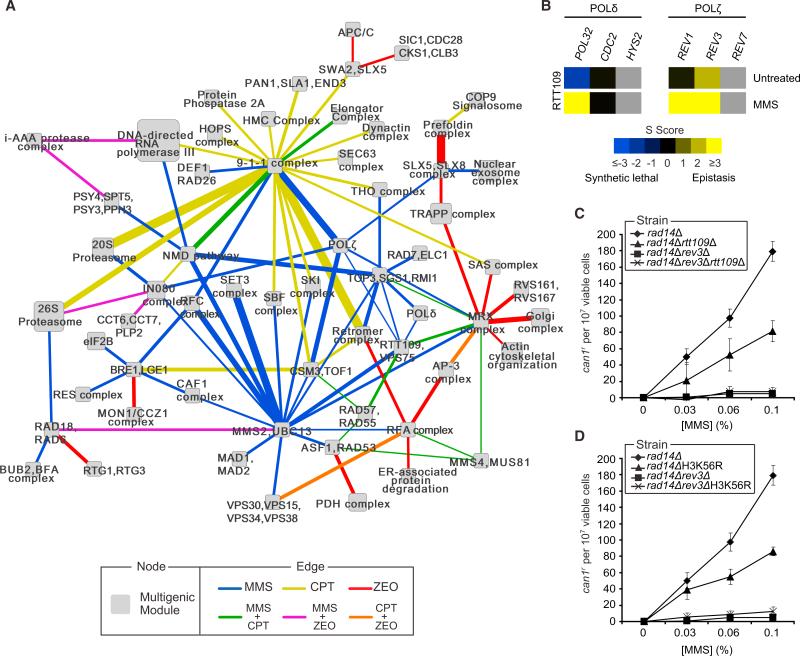
Figure 6. A Global Map of DDR Modules Reveals a Role for RTT109 in Translesion Synthesis.
(A) A map of multiprotein modules connected by bundles of differential genetic interactions. Node size scales with the number of proteins present in the module. Edge size scales with the significance of the enrichment for interactions spanning the two modules. For clarity only a portion of the entire map has been shown. The full list of module-module interactions is provided in Table S5.
(B) Genetic interactions observed between RTT109 and genes encoding members of the Polδ and Polζ complexes.
(C) MMS-induced can1r mutation frequencies in cells of the indicated genotype.
(D) As in (C), except that rad14ΔH3K56R and rad14Δrev3ΔH3K56R cells were used.
All data represent the mean ± 1 SD of three independent experiments. See also Figure S6, Table S4, Table S6, Table S6, and Data sets S1 and S2.

