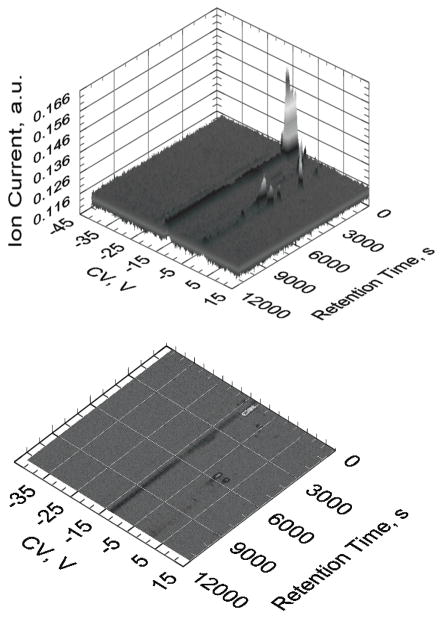
Figure 3.
Figure 3a & 3b. Representations of quality DMS plots from our asthma data. Fig. 2a (top) shows a 3-dimensional plot with compensation voltage (CV) on the x-axis, retention time on the y-axis, and ion count (IC) on the z-axis. Each VOC has a unique RT & CV which can be used to ultimately identify the VOC. Fig 2b (bottom) shows a typical 2-dimensional output view of the 3-dimensional graph in 2a.

