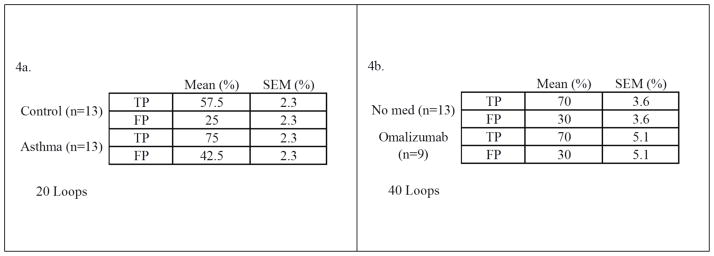
Figure 4.

Figure 4a & 4b. Confusion matrices describing the performance of the models to classify asthma from controls (Fig. 3a, left) and subjects taking omalizumab from those not taking this medication (Fig 3b, right). The left graph shows the mean results of 20 executed loops of the dataset. Right, the results of 40 loops are shown.
