
Figure 7.
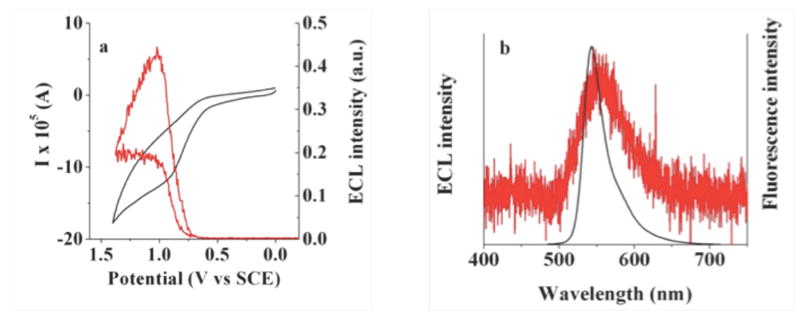
(a) Simultaneous ECL-CV experiment for an aqueous solution of 1 mM BOPEG3 containing 5 mM TPrA at a scan rate of 1 V/s. The CV trace is shown in black with ECL response in red. (b) ECL spectrum recorded for an aqueous 1 mM solution of BOPEG3 (red) overlaid onto the fluorescence spectrum of the BOPEG dye. A glassy carbon electrode with an area of 0.071 cm2 was used for ECL-CV measurements, while a glassy carbon electrode with area of 0.2 cm2 was employed to record the entire ECL spectrum. For both sets of experiments, 0.2 M NaNO3 was used as the supporting electrolyte and 0.1 M phosphate buffer was employed to maintain a solution pH of 7.0.