
Fig. 2.
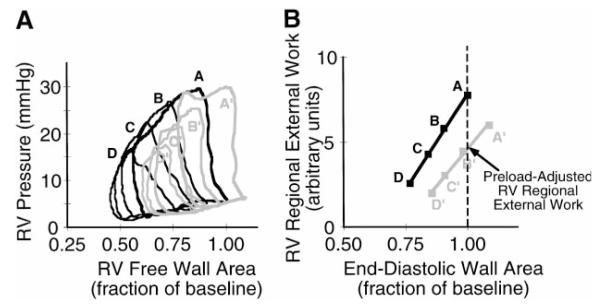
A: representative pressure-wall area loops obtained by brief occlusion of the inferior vena cava under baseline conditions (black lines, loops A–D) and at 1 h of recovery (gray lines, loops A’–D’). Only four loops are shown under each condition for clarity. Loops A (baseline) and A’ (recovery) were obtained under steady-state conditions before inferior vena cava occlusion. Note that loop A’ (recovery) has greater end-diastolic wall area and nearly identical end-diastolic pressure compared with loop A (baseline), but loop area (i.e., external work) is 24% lower and RV free wall systolic area reduction is 37% lower at 1 h of recovery compared with baseline. B: regional Frank-Starling relation derived from the data in A, demonstrating a downward and rightward shift in the relation at 1 h of recovery. The definition of preload-adjusted regional external work is shown (see text).