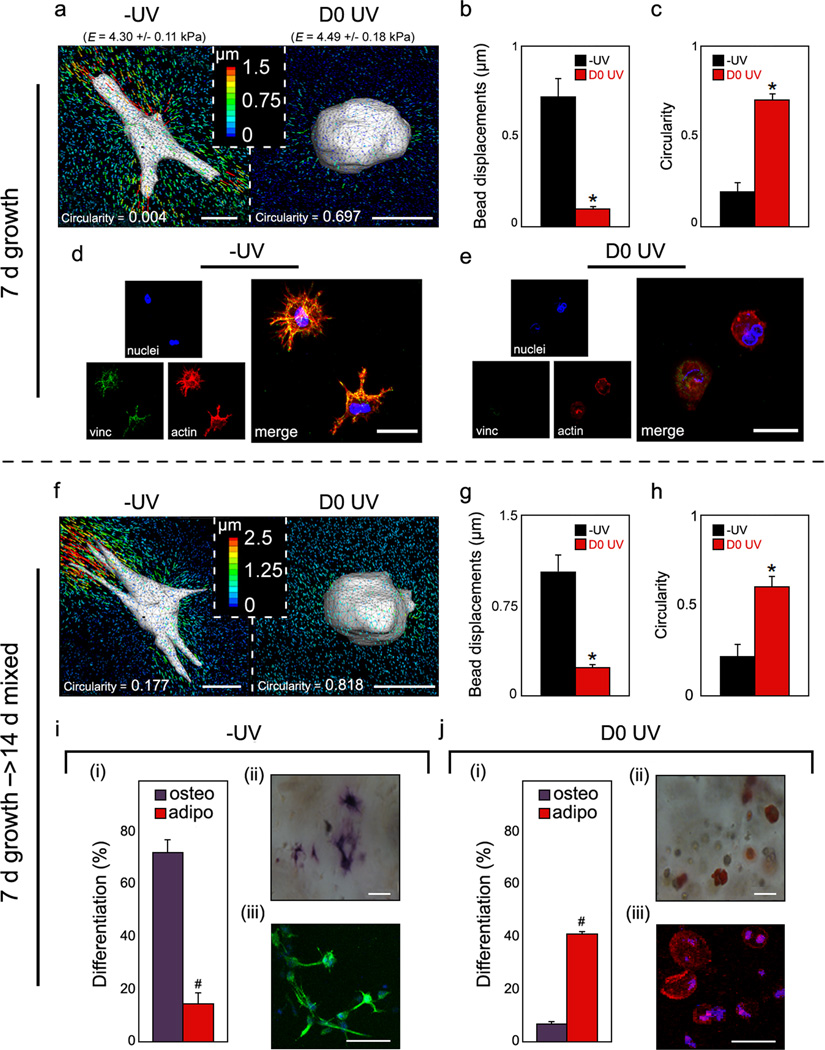
Figure 3.
MeMaHA hydrogel structure-dependent hMSC matrix interactions & fate choice. a,f, Representative 3D TFM images of hMSCs, b,g, average drift-corrected bead displacements within 15 µm of the cell surface (*p < 0.001, t test), and c,h, average circularity of hMSCs within −UV or D0 UV cells (*p < 0.001, t test), following a–c, 7 days incubation in growth media or f–h, an additional 14 days incubation in mixed osteogenic/adipogenic media. d–e, Representative staining for hMSC vinculin (green), actin (red), and nuclei (blue) in d −UV and e D0 UV gels. i–j, hMSC differentiation following 14 d mixed media incubation. i(i),j(i), percentage differentiation of hMSCs toward osteogenic or adipogenic lineages in i(i) −UV or j(i) D0 UV hydrogels (#p < 0.005, t test). i(ii–iii)–j(ii–iii), Representative bright field and fluorescent images of hMSCs; i(ii),j(ii), staining for ALP (osteogenesis) and lipid droplets (adipogenesis), or i(iii),j(iii), immunocytochemistry for osteocalcin (OC, osteogenesis) and fatty acid binding protein (FABP, adipogenesis) in i(ii–iii), −UV or j(ii–iii), D0 UV hydrogels, respectively. Error bars represent standard errors for the mean. Scale bars: a,f, 10 µm; d,e, 15 µm; i(ii),j(ii), 25 µm; i(iii),j(iii), 20 µm.

