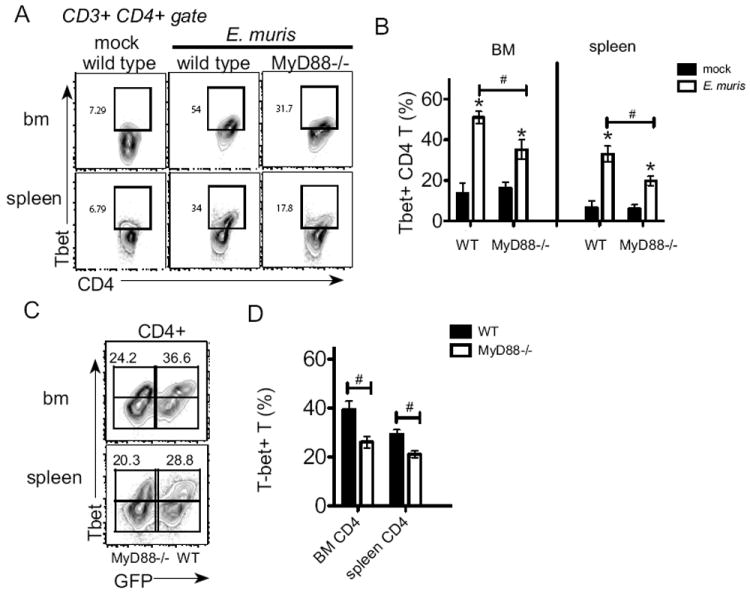
Figure 8. Intrinsic MyD88 signaling contributes to infection-induced increase in T-bet expression in CD4 T cells.

Intracellular staining was performed on bone marrow and spleen T lymphocytes to detect T-bet. (A) Representative flow plots of CD3+ CD4+ cells analyzed for expression of CD4 and T-bet; numbers on the plots represent the frequency of cells in each quadrant. (B) The average frequency of T-bet+ CD4 T cells in the bone marrow and spleen is shown. (C) Intracellular staining for T-bet was performed on bone marrow from mixed chimeric mice (wild type (GFP-positive): MyD88-deficient) on day 11 post-infection. CD3+ CD4+ cells were analyzed for expression of GFP and T-bet. Numbers represent the percentage of T-bet+ cells among wild type (GFP-positive) or MyD88-/- cells (GFP-negative) in the bone marrow and spleen of E.muris infected chimeric mice. (D) The average frequencies of T-bet+ CD4 T cells is shown for wild type (filled bar) and MyD88-deficienct (open bar) CD4 T cells in bone marrow and spleen are shown. Statistically significant differences are shown; # indicates differences between strains of mice, whereas * represent differences between mock and infected groups. This experiment was performed one time and experimental groups contained 5-7 mice.
