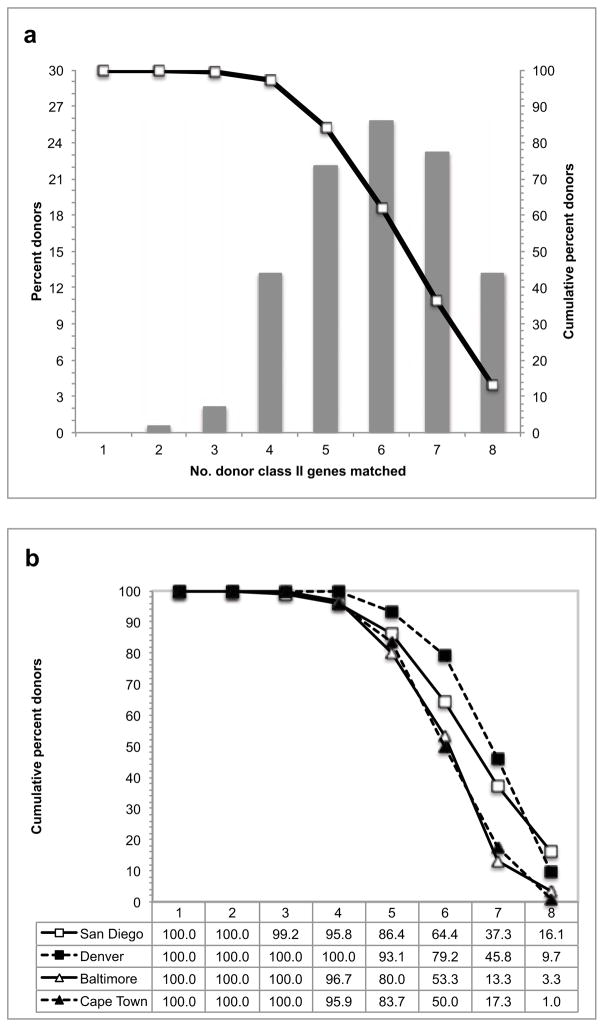
Fig. 1. Allelic coverage.
The HLA class II alleles represented in the panel of 46 single transfected cell lines provide coverage of the majority of HLA class II types expressed in a cohort of 190 donors recruited for two different studies in the San Diego area. The fraction of all donors for which the panel provides coverage of 0 to 8 possible class II types expressed is shown in the bar graph (a). The cumulative fraction of donors covered is shown in the line plot (a). This coverage is consistent across different donor cohorts from geographically disparate regions (b).

