Figure 1.
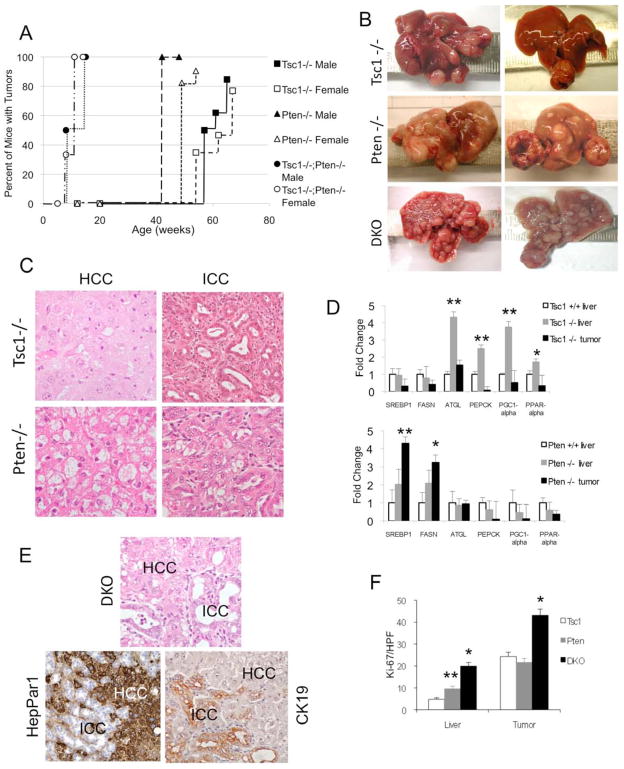
HCC and ICC in Tsc1−/−, Pten−/− and DKO livers. A) Incidence of liver tumors in each of the three models: Tsc1−/−, Pten−/− and Tsc1−/−;Pten−/− (DKO) mice stratified by sex. Cre-negative control mice did not develop liver tumors over the same time period (data not shown). B) Gross appearances of 64-wk Tsc1−/−, 52-wk Pten−/−, and 14-wk DKO livers. C) Representative H&E photomicrographs of HCC (left column) and ICC (right column) in Tsc1−/− and Pten−/− livers. Note ballooning and lipid accumulation in the Pten−/− HCC. Magnification: 400X. D) qRT-PCR analyses comparing the expression of metabolic genes in tumor, non-tumor livers and Cre–negative control (Tsc1+/+) livers. * p<0.05; ** p<0.01 compared to control. E) Histologic appearance of a mixed HCC-ICC in a DKO liver. HepPar1 immunoreactivity highlights HCC, and CK-19 highlights ICC. Magnification: 400X. F) Proliferation of non-tumor livers and tumors in each of the 3 models as determined by the number of Ki67-‘positive’ cells per high power field. Data obtained from 3 mice/group with 5 HPFs each. * p<0.01 compared to Tsc1−/− and Pten−/−; ** p<0.05 compared to Tsc1−/−.

