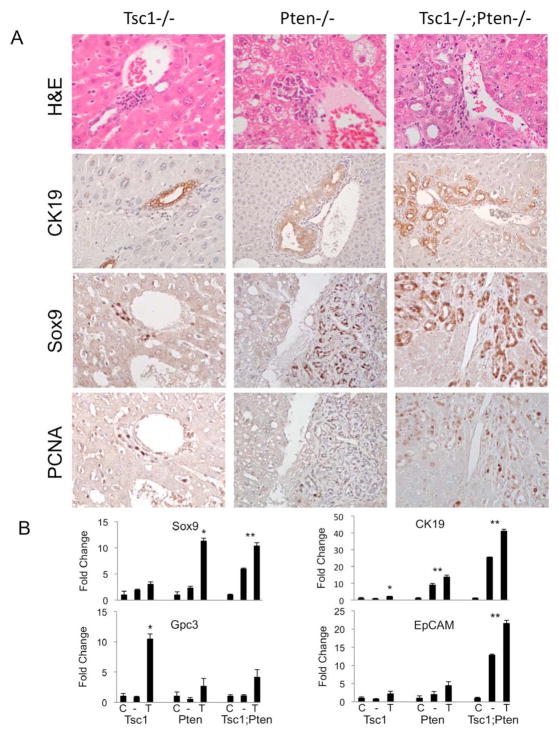
Figure 3.
Loss of Tsc1 and/or Pten is accompanied by an expansion of peri-portal progenitor cells. A) H&E staining shows variable accumulation of peri-ductal/portal cells in the 3 models (Top panels). CK19 expression is largely confined to the biliary epithelial cells. Sox9 and PCNA expression in the periportal regions are shown in serial histologic sections. Original magnification: 400X except for CK19 in Pten−/− and Tsc1−/−;Pten−/− (200X). B) mRNA expression of progenitor markers using qRT-PCR analyses of tissue samples from Cre-negative control livers (C), mutant livers (−), and tumors (T) in each of the 3 models. * p<0.05 comparing tumor (T) with non-tumor liver (−) and control liver (C). **p<0.05 comparing control liver (C) with non-tumor liver (−) and tumor (T).

