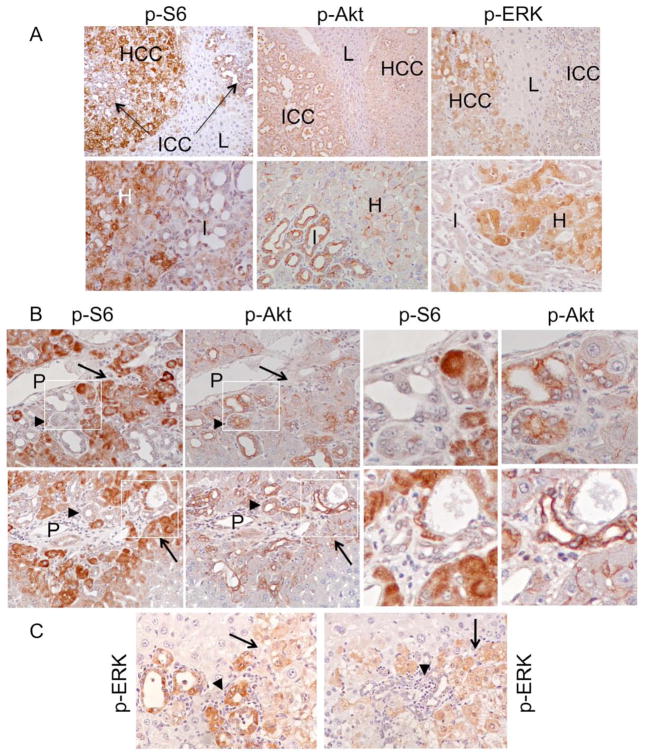
Figure 5.
Relationship between Akt/mTORC1, ERK and tumor differentiation. A) Expression of phospho-S6, phospho-Akt, and phospho-ERK in ICC (I), HCC (H) and adjacent non-tumor livers (L) based on IHC analyses. Top panel: 100x. Bottom panel: 400x. B) Serial sections of two DKO livers showing early peri-portal mixed tumors. Note contrasting phospho-S6 and phospho-Akt expression in the HCC (arrow) and ICC (arrowhead) components. P, portal vein. Left two columns: 400X. Right two columns: high magnification views of the boxed areas. C) Expression of phospho-ERK in two independent early mixed tumors. Arrowhead: ICC. Arrow: HCC. Original magnification: 400X.

