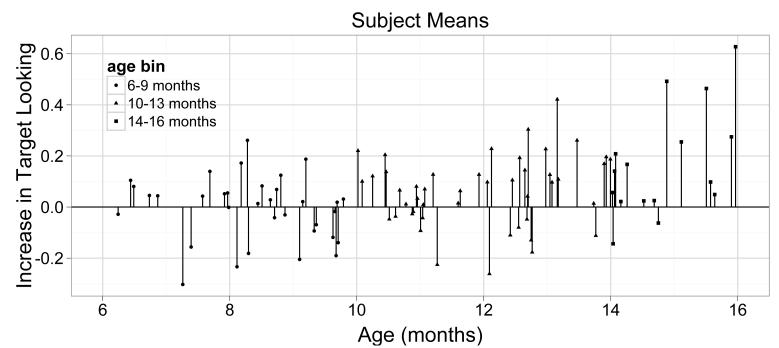
Fig. 2.
Target looking performance in each infant. Data are subject mean difference scores calculated over the 367-4000ms window. These were calculated by averaging the 7 item-pair mean difference scores for each subject. Symbols indicate the age bins used for statistical analyses; see text for details.

