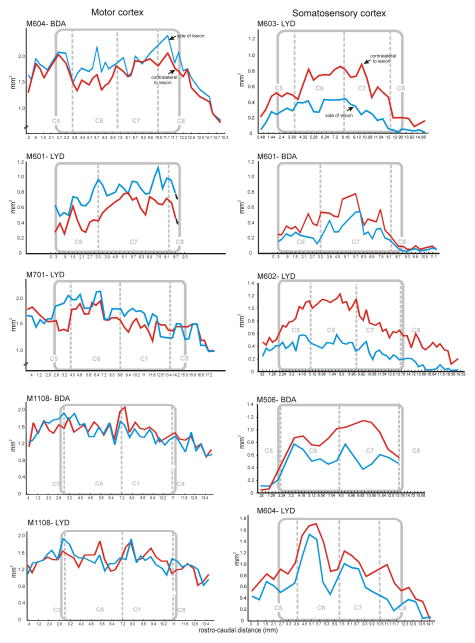
Figure 5.
Terminal distribution histogram profiles, comparing primary motor and somatosensory CST projection patterns in all animals. Territory areas for each section are indicated on the Y abscissa, and volumes were calculated per section (x interval to next section). Section number is shown on the X abscissa. Gray rectangles demarcate the rostrocaudal extent of the lesion (the lesion zone), relative to the cervical segments. Terminal territories (red line) were consistently smaller on the ipsilateral side compared to the contralateral side (blue line) for somatosensory CST projections. In contrast, and overall, the motor CST projection territories were not significantly different on the two sides of the cord. The average percentage differences are given in Table 1.

