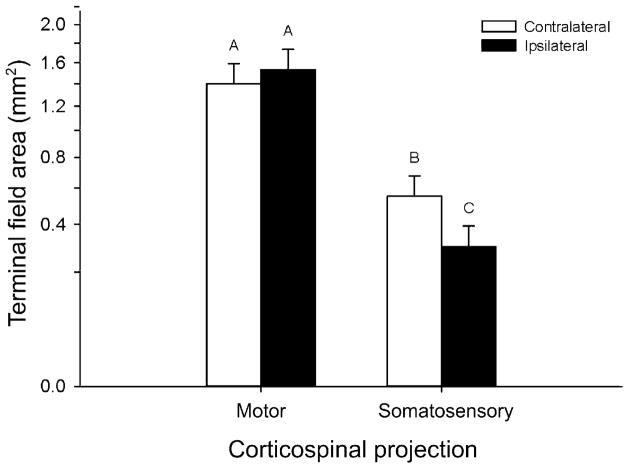
Figure 7.
Mean terminal field areas ipsilateral and contralateral to the lesion, for primary motor and S1 CST projections. Error bars are standard errors. Data were square-root transformed for analysis, and are displayed in transformed space, with real-world units on the y-axis. Superscripts above the means indicate means which do not differ significantly as determined by a Tukey test for multiple comparisons. Motor CST projections showed no difference between the sides of the cord overall, while somatosensory CST projections showed a marked decrease on the ipsilateral side of the cord.

