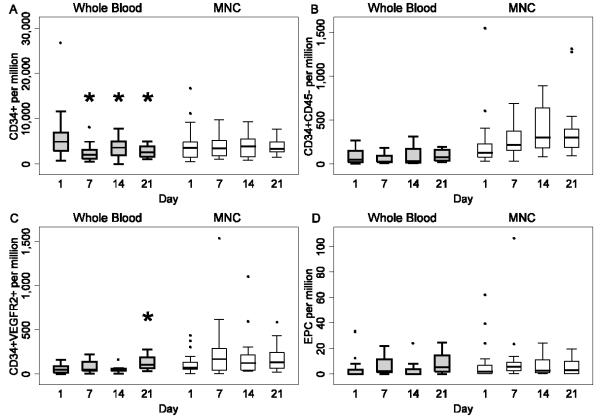
Figure 2. Variations in CD34+ cell subsets with postnatal age for preterm infants.
Box plots represent median, quartiles and range for the different CD34+ cell subsets in whole blood and MNC fraction. Panel A: CD34+ cells, panel B: CD34+CD45neg cells, panel C: CD34+VEGFR2+ cells, panel D: EPC. Whole blood data are shown in grey boxes and MNC data in the white boxes. CD34+ frequency in whole blood was lower at 7, 14 and 21 days compared to day 1 (p= 0.0001), *panel A and CD34+VEGFR2+ cell frequency in whole blood was higher on day 21 compared to day 1 (p= 0.0002), *panel C.

