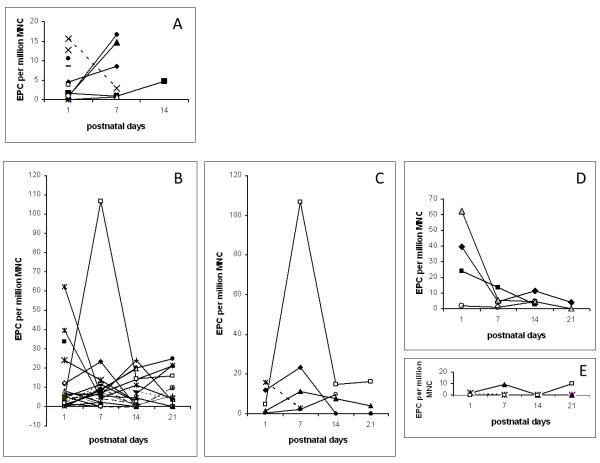
Figure 3. Pattern of change over time of EPC frequency by clinical subgroups.
Panel A: EPC frequency in 15 term infants. Three infants required mechanical ventilation on day 1 and showed an increase in EPC at 1 and 2 weeks (2 meconium aspiration, one transient tachypnea of the newborn who was treated for omphalitis). One infant with bacteremia at birth showed a decrease in EPC at 7 days compared to day 1 (dotted line). The other two did not show changes in EPC at 1 week. Panel B: data for all preterm infants 25 to 36 weeks GA. Panel C: EPC frequency for 5 patients with infections (one term infant with bacteremia shown in dotted line, and 4 preterm infants: 2 treated for clinical sepsis with CSF pleiocytosis (solid symbols), one developed NEC on day 6 of life and had a 24-fold increase in EPC number on day 7 (open square), and one preterm infant who had late onset yeast urinary infection (open circle)). Panel D: EPC frequency in 4 preterm infants born to mothers with chorioamnionitis and treated for suspected infection. Initial EPC was high in 3 of the 4 infants and decreased over time. Panel E: EPC in 4 preterm infants who developed BPD showing undetectable to low levels over a 3 weeks period.

