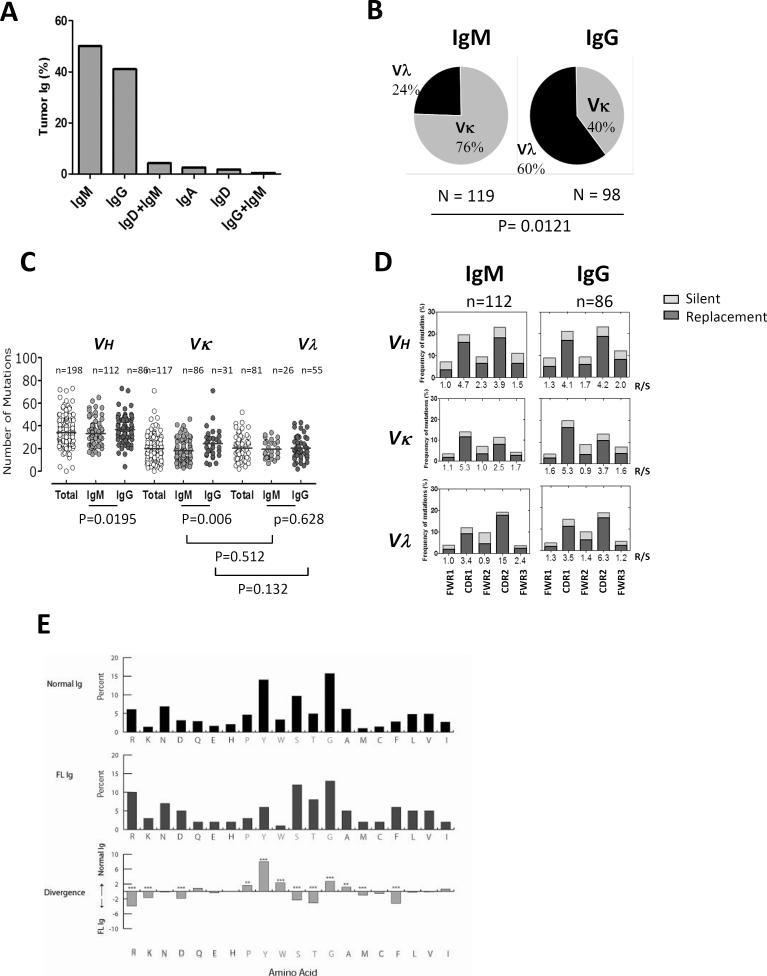
Figure 1. Heavy and light chain usage, mutational status, and amino acid usage of tumor Igs in FL.
(A) The percentage of tumors (n = 239) expressing different heavy chains as determined by flow cytometry. (B) The percentage of IgM+ and IgG+ FL tumors (n = 239) expressing Vκ and Vλ light chains as determined by flow cytometry. P was calculated using a 2 × 2 Fisher's exact test. (C) The total number of mutations in VH, Vκ, and Vλ genes from FWR1 to FWR3 in individual IgM+ (n = 112) and IgG+ (n = 86) FL tumors. Each dot represents data from one tumor, and the horizontal lines represent the average number of mutations for the group. P values were calculated using a two-tailed Student's t-test. (D) The frequency of replacement (R; black bar) and silent (S; gray) mutations in VH, Vκ, and Vλ were calculated and expressed as follows in the bar graphs: (number of nucleotide exchanges in each FWR and CDR / total number of nucleotides in the respective FWR and CDR) × 100. The R:S mutation ratio for each FWR and CDR is shown on the x-axis. (E) The frequency of amino acid usage in CDR-H3 loops of all FL Igs (middle) was compared with normal human B cells (top). Amino acids are listed in order of hydrophobicity as per a normalized Kyte-Doolittle hydrophobicity scale. Differences in amino acid frequencies between the two groups (bottom) were assessed by χ2 analysis (**p<0.001, ***p<0.0001).

