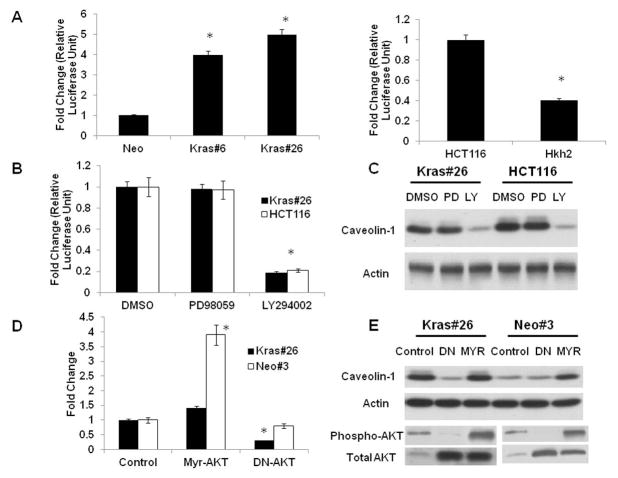
Figure 2. An activated K-RAS activated caveolin-1 transcription via the AKT pathway.
2A. Caveolin-1 promoter activity in Caco-2 and HCT116 isogenic systems.
Caco/Kras clones and HCT116-Hkh2 (0.5 × 10⁶ cells/well in 6-plate) were grown for 24 hours and transfected with a caveolin-1 promoter reporter. Forty eight hours after transfection, cells were lysed and luciferase activity measured as described in Materials and Methods. Results are the average of three independent transfections. *P<0.05 by t-test.
2B. Effect of MAPK and P-I3 kinase inhibitors on caveolin-1 promoter activity in Caco-2 and HCT116 isogenic systems.
CacoKras#26 and HCT116 cells (0.5 × 10⁶ cells/well in 6-plate) were grown for 24 hours and transfected with a caveolin-1 promoter reporter. Twenty four hours after transfection, cells were treated with inhibitors (50 μM of PD98059/Ly294002) for an additional 24 hours, lysed and luciferase activity measured as described in Materials and Methods. Results are the average of three independent transfections. *P<0.05 by t-test.
2C. Western blot analysis of caveolin-1 protein level in CacoKras#26 and HCT116 cells after treatment with ERK and P-I3 kinase inhibitors. Cells were grown in DMSO (control) or PD98059/LY294002 (50 μM each) for 48 hours. Cells were lysed in RIPA buffer and lysates were resolved on a 12.5% SDS-PAGE and probed for caveolin-1. Blot is representative of three independent experiments.
2D and 2E. Caveolin-1 transcript and protein levels are influenced by AKT activity.
Caco/Kras clones (0.5 × 10⁶ cells/well in 6-plate) were grown for 24 hours and transfected with a dominant negative (DN) or an activated (Myr) AKT construct. The next day, fresh medium was added. After 48 hours, RNA and protein were extracted and caveolin-1 levels were determined by quantitative RT-PCR (2D) and Western blotting (2E) as described in Materials and Methods. Western blot depicting expression of phospho-AKT and total AKT protein are shown in the lower panel of Figure 2E. Figure is representative of three independent experiments *P<0.05 by t-test.

