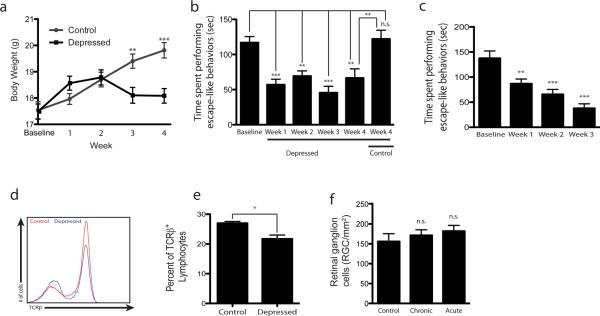
Figure 1. Depressive behavior does not affect neuronal survival after CNS injury.
C57Bl/6J mice underwent unpredicted chronic mild stress to induce depressive behavior. (a) Weights were recorded weekly and a characteristic drop in weight is seen in a stressed group (tweek3=3.38, tweek4=4.50). (b) Bar graphs represent times the mice spent in escape-like behaviors during the last 4 minutes of 6 minute-long tail suspension (Tweek1=5.09, tweek2=3.97, tweek3=5.83, tweek4=3.55, tcontrol-baseline=0.37). (c) Bar graphs represent times the mice spent in escape-like behaviors during the last 4 minutes of 6 minute-long forced swim test (tweek1=3.31, tweek2=4.69, tweek3=6.50). (d, e) Cervical lymph nodes were examined for T cell levels in control and depressed mice (after 4 weeks of chronic stress). (d) Representative histogram of TCRβ+ cells is shown. (e) Bar graph represents percent of TCRb lymphocytes in the dCLN that are CD4+ by flow cytometry. (t(8) = 3.1, p=0.015), (f) Graphs represent retinal ganglion cell (RGC) survival after optic nerve crush injury in non-stressed, acutely stressed and chronically stressed (depressed) mice (tchronic=0.6, tacute=1.1). For statistical analysis one-way ANOVA with Bonferroni's post-test was used (**p<0.01, ***p<0.001).

