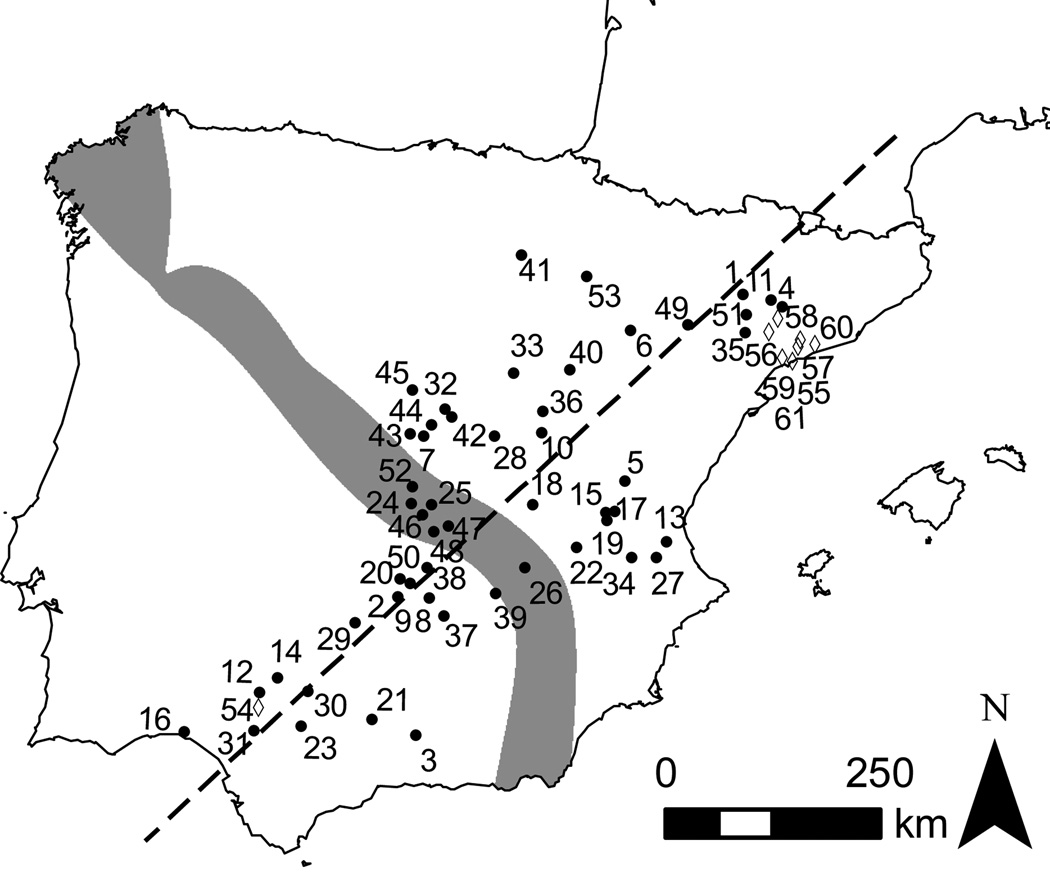
Figure 1.
Map of the Iberian Peninsula indicating the sampled localities across the hybrid zone between O. c. algirus and O. c. cuniculus. Grey indicates the approximate location of the hybrid zone based on allozyme and mtDNA data obtained from a small number of localities (Ferrand and Branco 2007). Sampled localities are indicated by circles and numbers correspond to those in Supplementary Table 1. Populations excluded from cline analysis due to probable restocking activities are represented by diamonds (see Results). The dashed line shows the orientation of the maximum gradient in allele frequency change in two-dimensional space estimated using PAVA (see Material and Methods for details).

