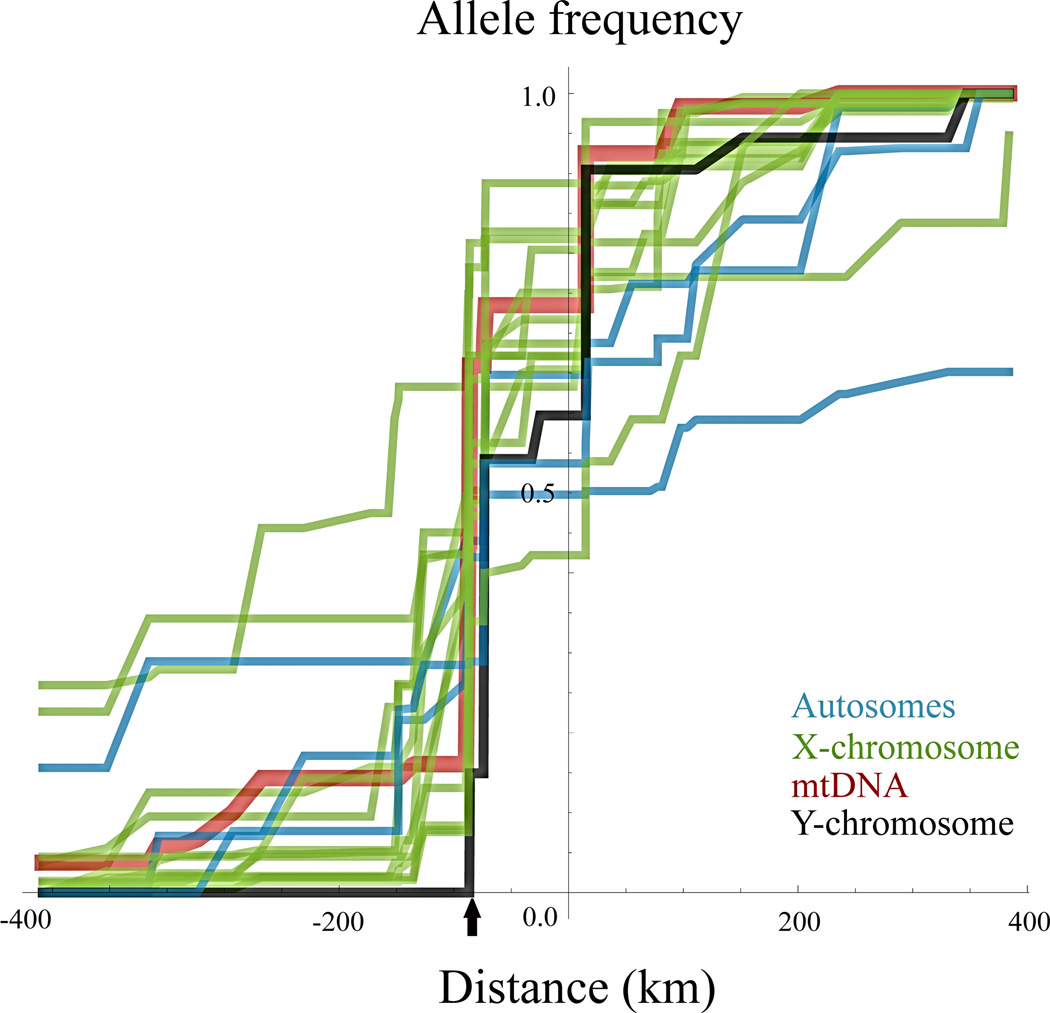
Figure 3.
A summary of clinal patterns at autosomal, X-chromosome, mtDNA and Y-chromosome loci without constraint to any particular model of monotonic change. Individual loci are detailed in Supplementary Figure 2. Maximum likelihood monotonic clines are fitted using the PAVA algorithm. The comparison among all clines shows heterogeneous introgression patterns away from the center. The consensus zone center is marked with a black arrow.

