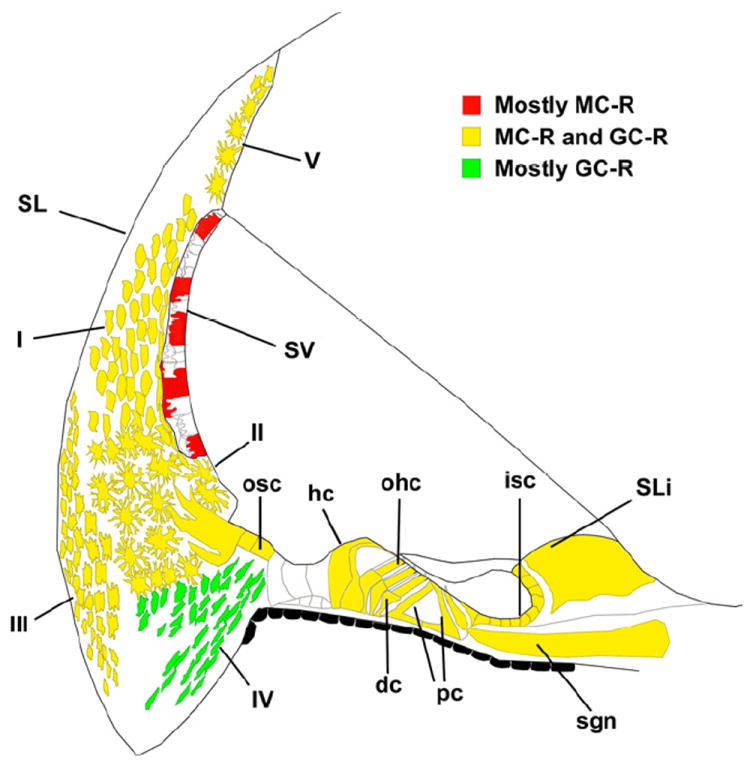
Figure 12. Diagram of the guinea pig cochlear partition depicting the distribution of MC-R and GC-R suggested by the results reported in this study.

Red color indicate mostly MC-R protein expression, yellow color indicates both MC-R and GC-R expression and green indicate GC-R expression. Modified from (Imamura et al., 2003)
