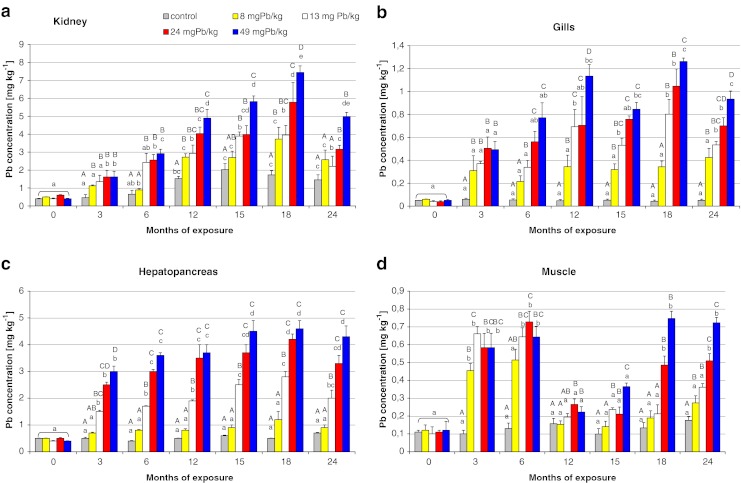
Fig. 1.

The comparison of mean lead concentration (milligrams per kilogram tissue wet weight) in the kidney, gills, hepatopancreas, and muscle of Prussian carp females during 24-month period dietary exposure to different levels of lead in the diet. Different letters indicate statistically significant differences among groups at p < 0.05 (Mann–Whitney U test). Values not sharing uppercase letters are significantly different from other treatment values within the same sampling. Values not sharing lowercase letters are significantly different from the same treatment between months. Note the different y-axis scale
