
Figure 2.
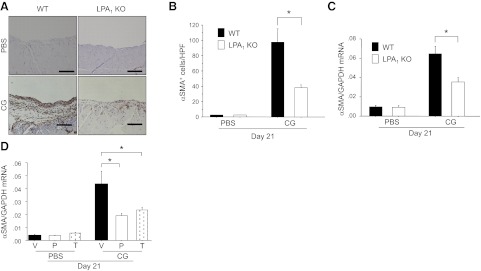
CG-induced peritoneal αSMA+ myofibroblast accumulation is dependent on LPA1. A) Peritoneal accumulation of αSMA+ myofibroblasts after CG challenges. Representative peritoneal sections of WT (left) and LPA1-KO mice (right) stained with anti-αSMA antibody/peroxidase are shown from mice after 21 d of PBS or CG injections (×200). Scale bars = 100 μm. B) Numbers of αSMA+ cells in the submesothelial zone, expressed as mean number per HPF (d 21 PBS, n=5 mice/genotype; d 21 CG, n=5 mice/genotype). C) Peritoneal expression of αSMA mRNA in WT and LPA1-KO mice following CG or PBS challenges, expressed as mean copies of αSMA mRNA relative to copies of GAPDH mRNA (d 21 PBS, n=5 mice/genotype; d 21 CG, n=5 mice/genotype). D) Peritoneal expression of αSMA mRNA following CG or PBS challenges in AM095-treated mice, expressed as mean copies of αSMA mRNA relative to copies of GAPDH mRNA (d 21 PBS, n=6 mice/treatment group; d 21 CG, n=6 mice/treatment group). V, vehicle; P, preventive AM095; T, therapeutic AM095. Data are expressed as means ± se. *P < 0.01.