
Figure 4.
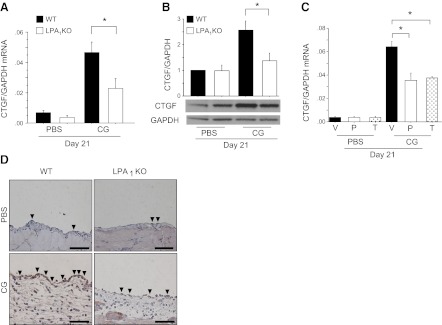
CG-induced CTGF expression is dependent on LPA1 and is predominantly attributable to peritoneal mesothelial cells. A) Peritoneal expression of CTGF mRNA in WT and LPA1-KO mice following CG or PBS challenges (d 21 PBS, n=5 mice/genotype; d 21 CG, n=5 mice/genotype). Data are expressed as mean copies of CTGF mRNA relative to copies of GAPDH mRNA. B) Peritoneal expression of CTGF protein in WT and LPA1-KO mice following CG or PBS challenges (d 21 PBS, n=4 mice/genotype; d 21 CG, n=4 mice/genotype. Quantification was performed with ImageJ software; data are expressed as mean density of CTGF bands relative to GAPDH bands. C) Peritoneal expression of CTGF mRNA in vehicle and AM095-treated mice following CG or PBS challenges (d 21 PBS, n=6 mice/treatment group; d 21 CG, n=6 mice/treatment group). V, vehicle; P, preventive AM095; T, therapeutic AM095. Data are expressed as mean copies of CTGF mRNA relative to copies of GAPDH mRNA. D) Peritoneal location of CTGF protein in representative sections from WT and LPA1-KO mice following PBS and CG challenges, stained with anti-CTGF antibody/peroxidase (×400). Arrowheads indicate CTGF+ mesothelial cells. Scale bars = 50 μm. Data are expressed as means ± se. *P < 0.01.