Figure 9.
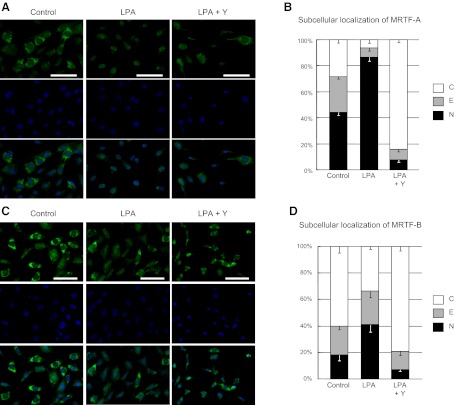
LPA promotes the nuclear translocation of MRTF-A and MRTF-B in a ROCK-dependent manner. A, C) Subcellular distributions of MRTF-A (A) and MRTF-B (C) were visualized by immunocytochemistry in PMCs that had been incubated in serum-free medium for 24 h and then stimulated with medium containing LPA (10 μM for 30 min) or control medium. Green represents MRTF-A or MRTF-B staining; blue represents DAPI staining. PMCs were additionally pretreated with Y27632 (Y; 5 μM) or control medium for 30 min before LPA stimulation. All images were captured using identical exposure settings. Scale bars = 100 μm. B, D) Quantification of the subcellular distribution of MRTF-A (B) and MRTF-B (D). Five random fields of view were counted per slide. Subcellular distributions were classified as nuclear (N; nuclear staining > cytoplasmic staining); equal (E; nuclear staining = cytoplasmic staining); or cytoplasmic (C; nuclear staining < cytoplasmic staining). Two independent series of PMCs were analyzed. All data are expressed as mean ± se distribution. Significant (P<0.01) comparisons for both MRTF-A and MRTF-B were percentages of cells with nuclear distributions, and percentages of cells with cytoplasmic distributions, in LPA alone vs. control, and LPA alone vs. LPA + Y27632.

