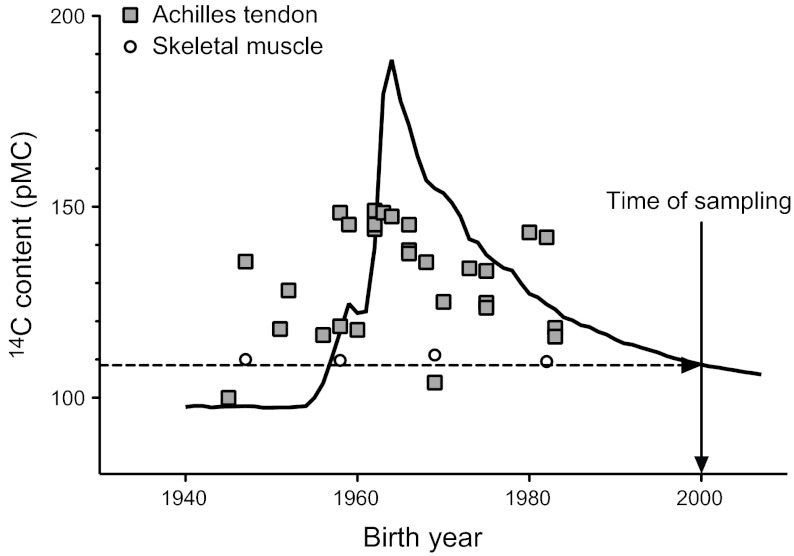
Figure 1.
14C bomb-pulse curve. Concentration of 14C in atmospheric CO2 (black line), shown as pMC (26). Testing of nuclear bombs from 1955 to 1963 nearly doubled the atmospheric levels of 14C, which was followed by an exponential decrease after the Test Ban Treaty in 1963. Measured levels of 14C are shown in relation to birth year for samples of human Achilles tendon (gray squares) and skeletal muscle (open circles) taken in year 2000. The levels of 14C found in the tendon tissue generally correspond to the atmospheric levels many years before sampling, thus indicating a very slow rate of tissue replacement. Skeletal muscle levels of 14C correspond to atmospheric levels ∼2 yr before the time of sampling (dashed arrow), thus indicating continuous tissue turnover, as essentially no memory of lifetime exposure to the bomb pulse remains in the muscle tissue.

