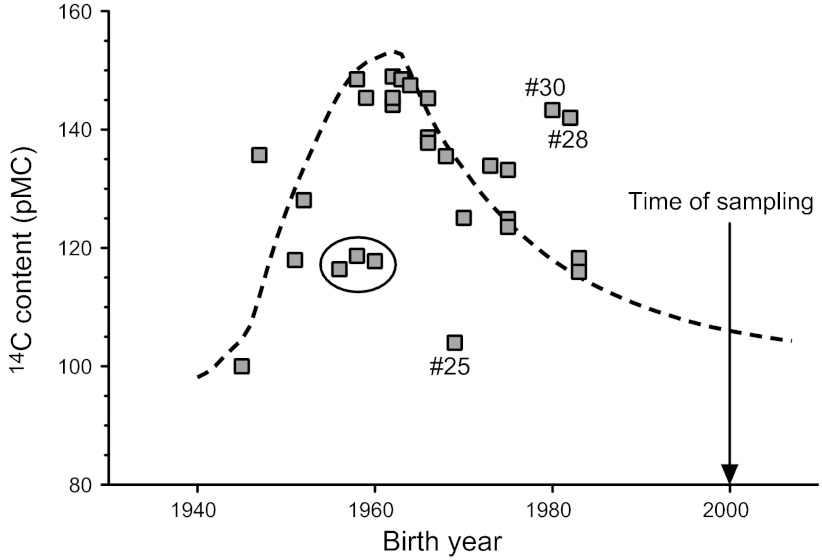
Figure 2.
Model for human tendon tissue formation and turnover. Dotted line shows the 0–17 yr moving average of the 14C level in the atmosphere, representing the relation between calendar year and the average atmospheric 14C level during the subsequent 17 yr (e.g., value in 1960 corresponds to average atmospheric 14C between 1960 and 1977). The curve reproduces relatively well the observed levels of 14C in Achilles tendons samples (gray squares), suggesting that the tendon tissue 14C was incorporated during height growth (0–17 yr) and that tissue replacement during adulthood was very limited. The large black circle indicates three tendon samples with deviating 14C concentrations, potentially due to abnormally high turnover during later periods in life with low atmospheric 14C. The dataset contained three clear outliers, indicated as #25, #28, and #30.

