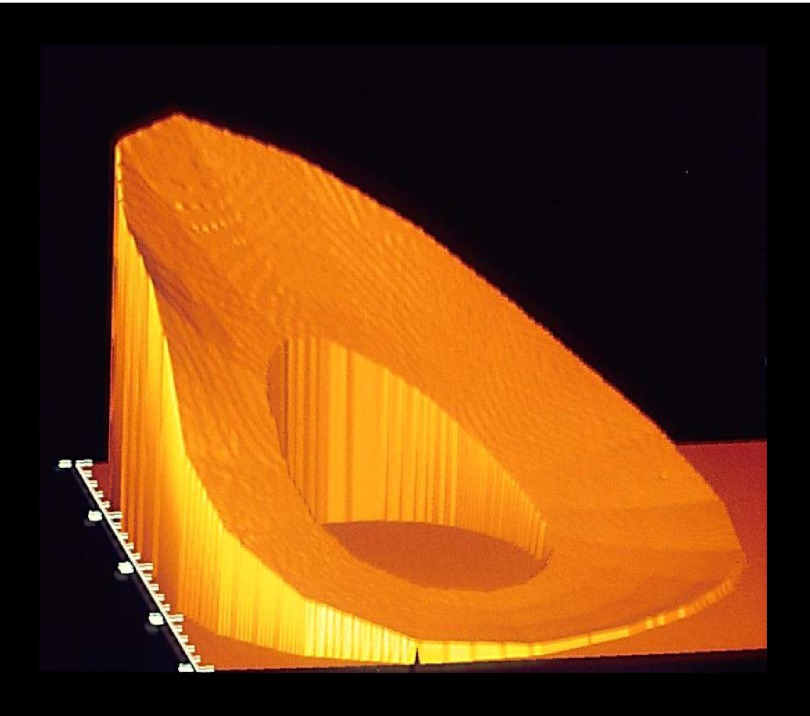
Figure 5.
Spatial distribution of SED integrated over an entire stride (SPD), for a 7 m/s canter. The maximum magnitude of SPD varied little with gait, while mean SPD was similar across gaits, implying the amount of power was normalized by the differences in time the hoof made contact with the ground. To better visualize the 32-fold disparity between peak and minimal SPD during the canter, the posterior (ventral) aspect of the MCIII is toward the left; lateral aspect is toward the bottom.

