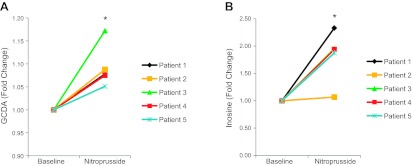
Figure 5.

Metabolic perturbations in humans treated with nitroprusside. A) LC-MS metabolomic analysis of GCDA in the plasma of nitroprusside treated humans (n=5). B) Metabolic profiling of inosine in the plasma of nitroprusside-treated humans (n=5). Data are represented as metabolite concentrations prenitroprusside and postnitroprusside treatment for each patient. *P < 0.05; paired t test.
