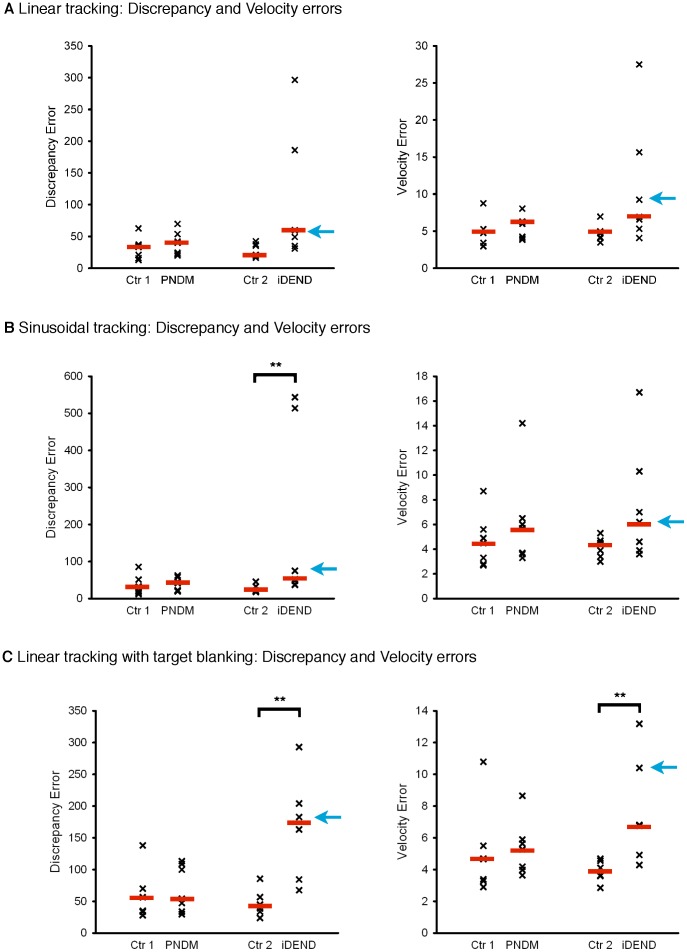
Figure 2. Tracking performance of patients with PNDM and iDEND on three different tasks.
Scatter plots showing the performance of participants who tracked: a target moving at constant velocity (linear tracking) (A); a target moving with variable velocity (sinusoidal tracking) (B); and a target moving at constant velocity which was blanked during the middle third of each sweep (C). In each case the left panel shows discrepancy errors and the right panel velocity errors. (A) Data for PNDM (n = 7) and iDEND (n = 7) patients and their matched control, as indicated. There were no significant differences in the two error types between the groups (Kruskal-Wallis tests; p = 0.06 for discrepancy errors, p = 0.07 for velocity errors). (B) Data for PNDM (n = 7) and iDEND (n = 7) patients and their matched controls, as indicated. Patients with iDEND incurred significantly higher discrepancy errors than controls, but PNDM patients were not affected. **, p<0.01, post-hoc Mann-Whitney U-test. There were no significant differences in the velocity errors between the groups (Kruskal-Wallis test). (C) Data for PNDM (n = 7) and iDEND patients (n = 6) and their matched controls, as indicated. The target was blanked during the middle third of each sweep. Patients with iDEND were significantly less accurate than controls but PNDM patients were not different. **, p<0.01, post-hoc Mann-Whitney U-tests. In all figures the red bars indicate the median error and the blue arrows indicate data points for the iDEND patient shown in Figure 1.

