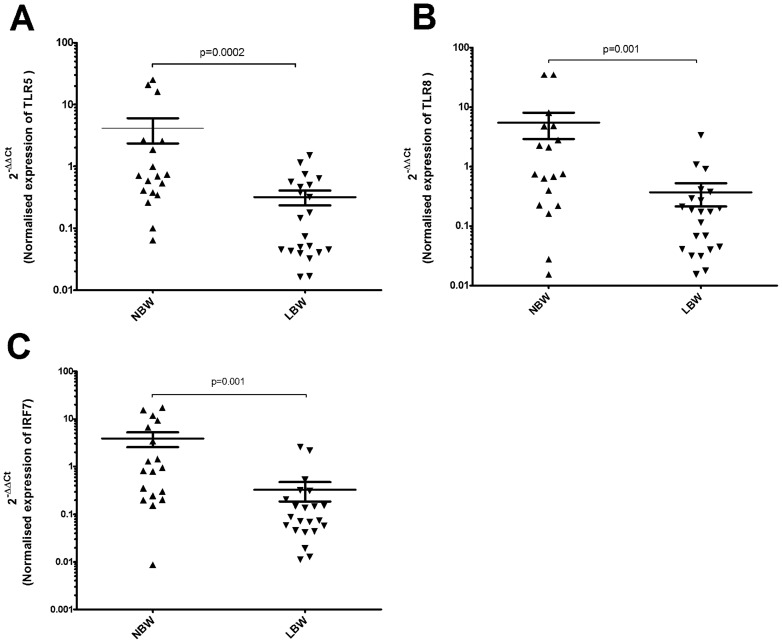
Figure 7. Quantitative Real-Time PCR validation of differentially expressed genes.
Down regulation of (A) TLR-5 mRNA expression (B) TLR-8 mRNA expression (C) IRF-7 mRNA expression in LBW newborns compared to NBW newborns. The y-axis is a log10 scale. Black up pointing triangle (▴) denotes NBW samples (n = 22) and black down pointing triangle (▾) denotes LBW (n = 18) samples. The significant difference in mRNA level expression between LBW and NBW newborns is represented as p<0.05.

