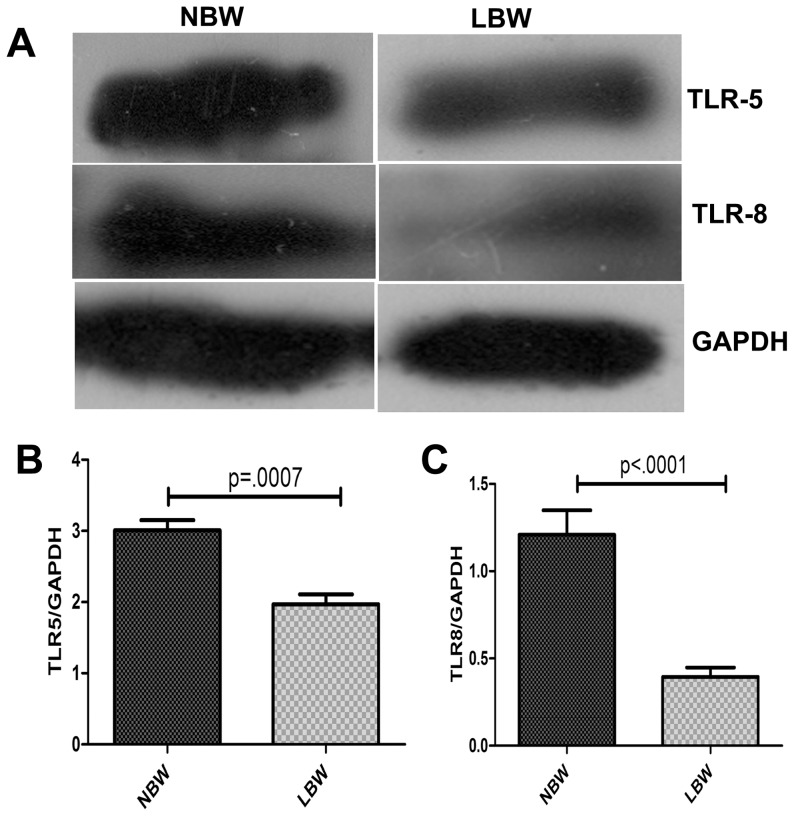
Figure 8. Representative western blot figure for expression of TLR5 and TLR8 levels.
(A) Expression of TLR5 and TLR8 in NBW and LBW newborns. Densitometric analysis of (B) TLR5 and (C) TLR8 gene normalised against GAPDH in LBW and NBW newborns. The difference in TLR5 and TLR8 expression levels between LBW and NBW newborns was significant; p<0.05, (LBW = 12, NBW = 12).

