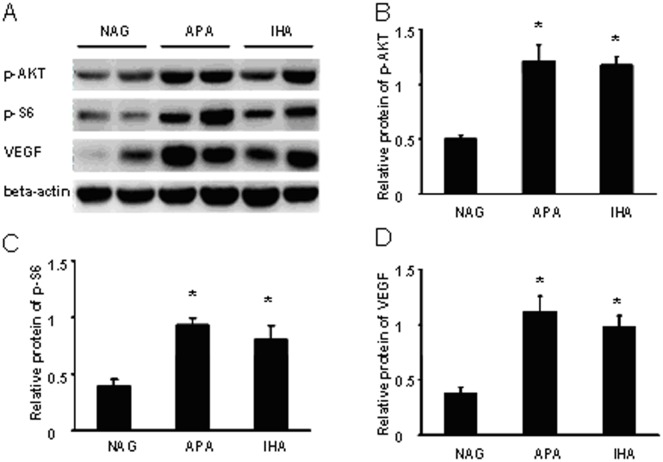
Figure 2. Different activities of PI3K/AKT/mTOR signaling pathway in NAGs, APA and IHA patients.
Proteins were analyzed by western blotting using monoclonal antibodies specific for the protein forms. NAGs served as a reference. Panel A shows that p-AKT, p-S6 and VEGF are highly elevated in APA and IHA tissues compared with NAGs. β-actin was used as the endogenous control protein. Panels B, C and D reveal significant elevations of the p-AKT/β-actin, p-S6/β-actin and VEGF/β-actin ratios in APA and IHA tissues by photodensitometric analysis. There were significant differences in the ratios of p-AKT/β-actin, p-S6/β-actin and VEGF/β-actin between NAGs and APA and IHA tissues. Mean and SEM shown; t test:* P<0.05, in comparison with NAGs.

