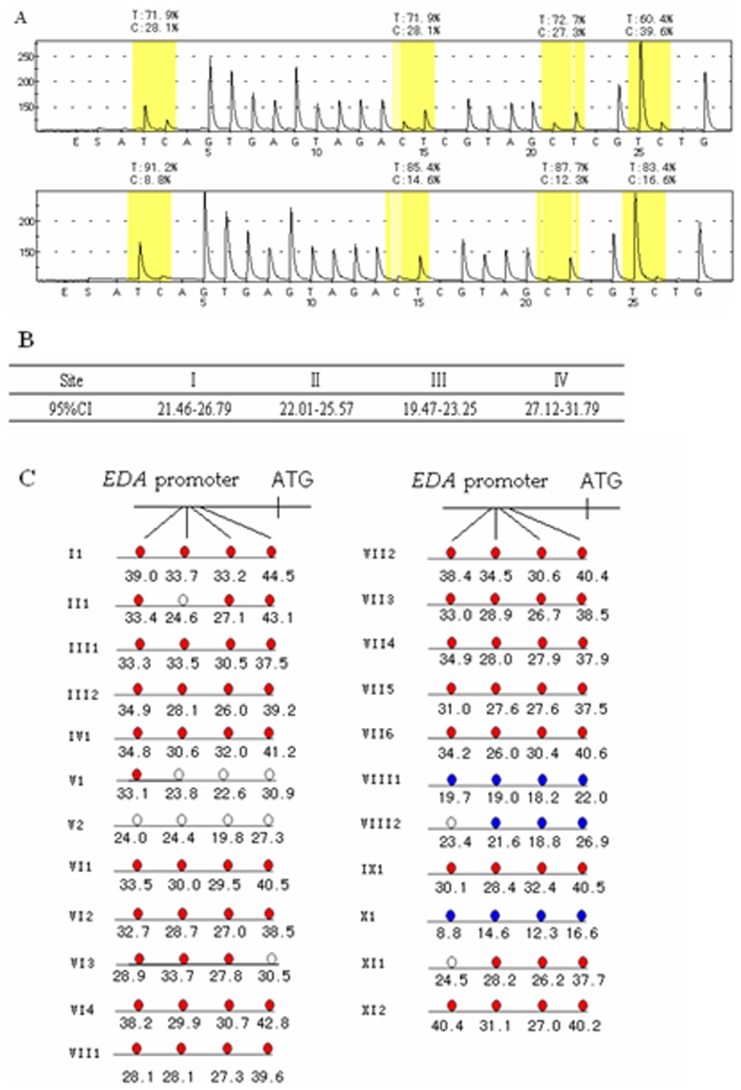
Figure 3. EDA promoter’s methylation analysis of 23 carriers.
(A) Pyrosequencing graphs of 2 samples, a hypermethylation carrier and a hypomethylation carrier. Peak heights are proportional to the number of identical residues incorporated. Percentage in pictures means allele frequency of each site. (B) The 95% CI for the 4 sites. The figures which refer to methyl-cytosine percent at that site are calculated as described in the text. (C) The methylation state of each carriers in the 4 sites. Red, white and blue refer to hypermethylation, normal and hypomethylation respectively.

