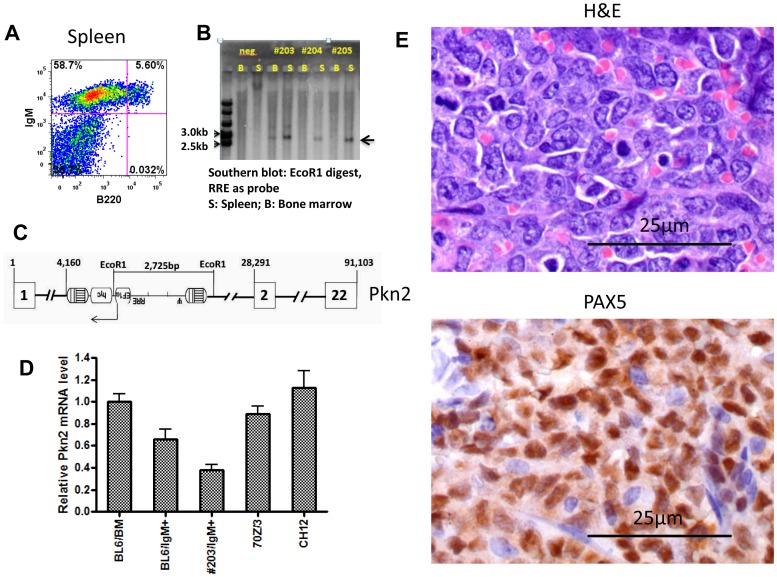
Figure 2. Characterization of B cell leukemias in three secondary recipients that received bone marrow cells from one primary recipient in experiment 1 in the EF1α vector group.
(A) Flow cytometry analysis of spleen cells in an affected secondary recipient. Staining was done for surface expression of IgM (Y axis) and B220 (X axis) and percentages of cells in each gate are indicated. (B) Southern blot analysis of DNA from bone marrow and spleen cells using a vector probe and a single cutter enzyme for insertion site analysis. Bone marrow and spleen cell samples are indicated and identification of individual secondary mice is shown. The arrow indicated a clonal band derived from a single vector insertion in all three cases. (C) Inverse-PCR identification of the vector insertion event is shown. The vector is inserted in the first intron of the Pkn2 gene in the reverse genomic orientation. The location of the EcoRI sites used in the Southern analysis is shown as well as relative nucleotide distances. Exons are shown in boxes with corresponding numbers. (D) Quantitative real time PCR analysis of the Pkn2 transcripts in tumor cells and controls. Unfractionated total bone marrow cells (BL6/BM) was used as Pkn2 expression reference and the value was arbitrarily set as 1. Also shown are values for sorted IgM+ cells from spleen of a healthy C57BL6 mouse (BL6-IgM), sorted IgM+ leukemic cells from spleen of secondary recipient mouse (#203/IgM+), murine pre-B cell lymphoma cell line (70Z/3), and a murine mature-B cell lymphoma cell line (CH12). (E) Histology and immunohistochemistry for Pax5 expression are shown for a splenic B cell tumor from a secondary recipient are shown with size markers in the lower left of each panel.

