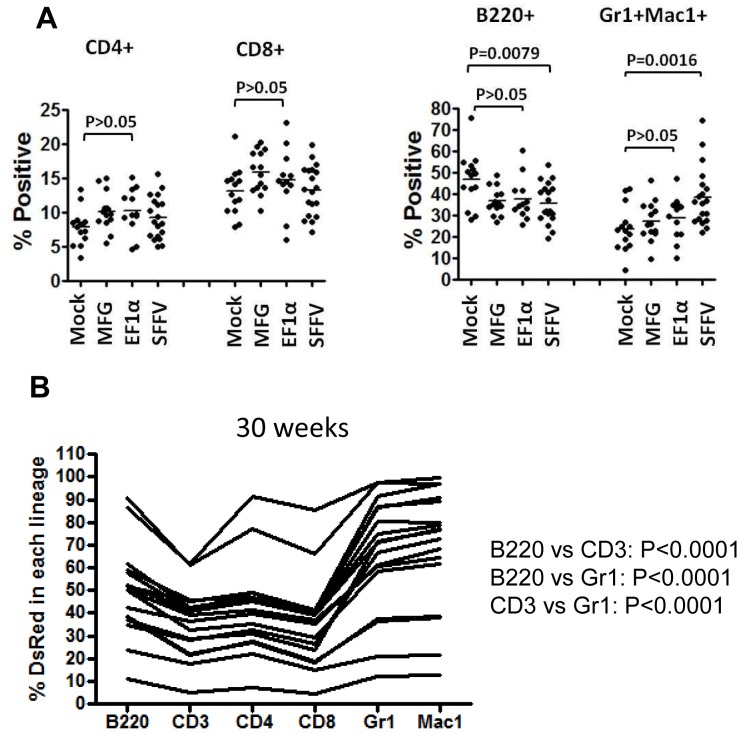
Figure 5. Skewing of myeloid differentiation in mice transplanted with SFFV-transduced cells.
(A) Percentage of peripheral blood cells in specific hematopoietic lineages at 30 weeks after transplantation. Each dot represents the percent of cells from a given lineage, as determined by flow cytometry, from a single primary transplant recipient from each of the vector groups listed on the X-axis. Statistical comparisons are shown for the indicated groups giving the p value. This analysis demonstrated a significant increase in cells expressing either the Gr1 or the Mac1 marker. (B) Percentage of DsRed+ peripheral blood cells in each lineage in the SFFV group of primary recipients at 30 weeks after transplant. Each line represents the profile from a single mouse and the lineages are indicated on the X-axis.

