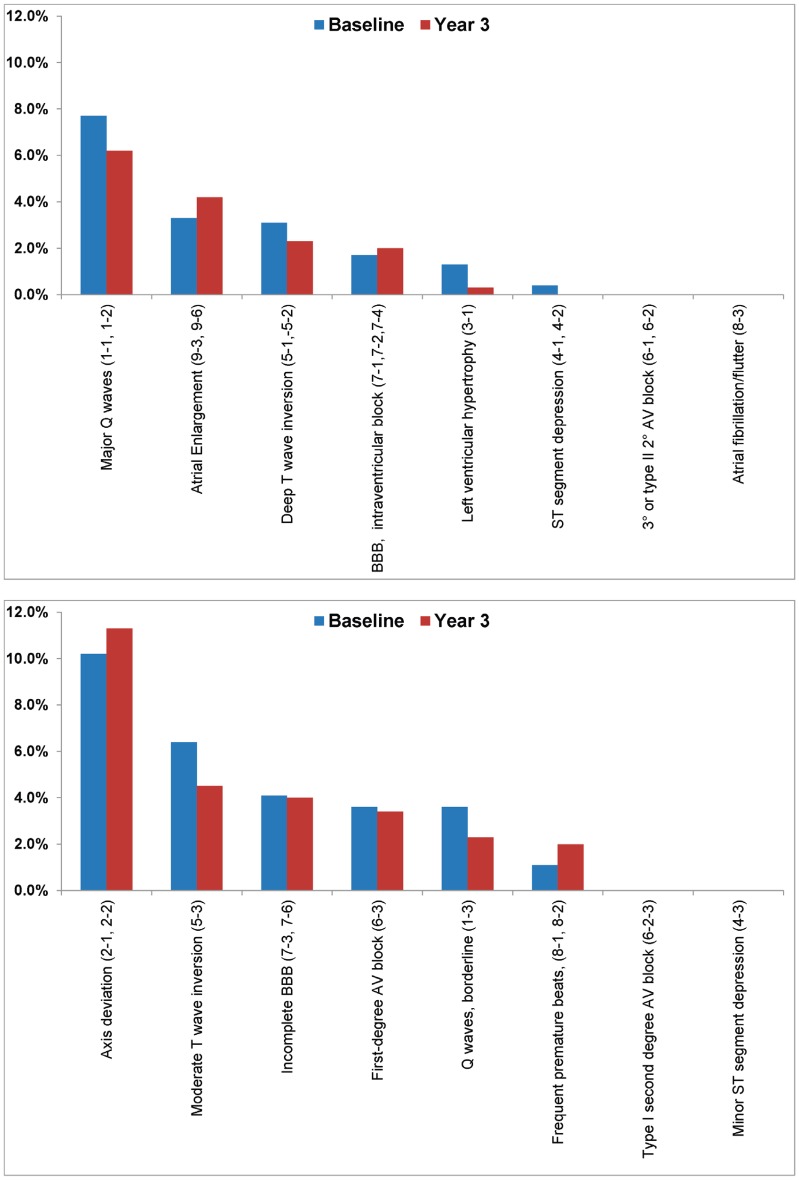
Figure 2. (A). Prevalence of Specific Major ECG Abnormalities. (B). Prevalence of Specific Minor ECG Abnormalities.
Figure 2A shows percentages of the specific major ECG abnormalities and figure 2B shows percentages of the specific minor ECG abnormalities at baseline (blue) and at year 3 (red). Year 3 percentages include both continued smokers and those who abstained. All p-values for comparisons between baseline and year 3 ECG abnormalities were non-significant (<0.05). BBB = Bundle Branch Block; AV = Atrioventricular.

