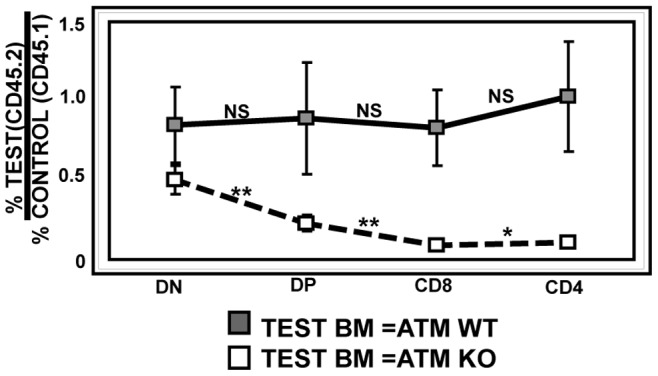
Figure 5. Competitive chimeras demonstrate that the ATMKO defect in DN to DP development is T cell-intrinsic.

This graph shows the ratio of thymocytes derived from test (ATMWT or KO CD45.2+) and control (ATMWT CD45.1+) bone marrow for each thymic subset. When both test (CD45.2+) and control (CD45.1+) bone marrows are ATMWT (solid black line), the ratio of test/control cells is not significantly changed during thymic development. In contrast, when test bone marrow is ATMKO (CD45.2+) (dashed black line) the ratio of test/control (ATMKO/ATMWT) cells decreases as thymocytes develop from DN to DP cells (p<0.007) and from DP to CD8 (p<0.005) or CD4 (p<0.02) SP cells. Data from two independent sets of chimeras consisting of 16–20 mice in each group were combined for this analysis. P values were calculated using Student’s unpaired 1-tailed t-test.
