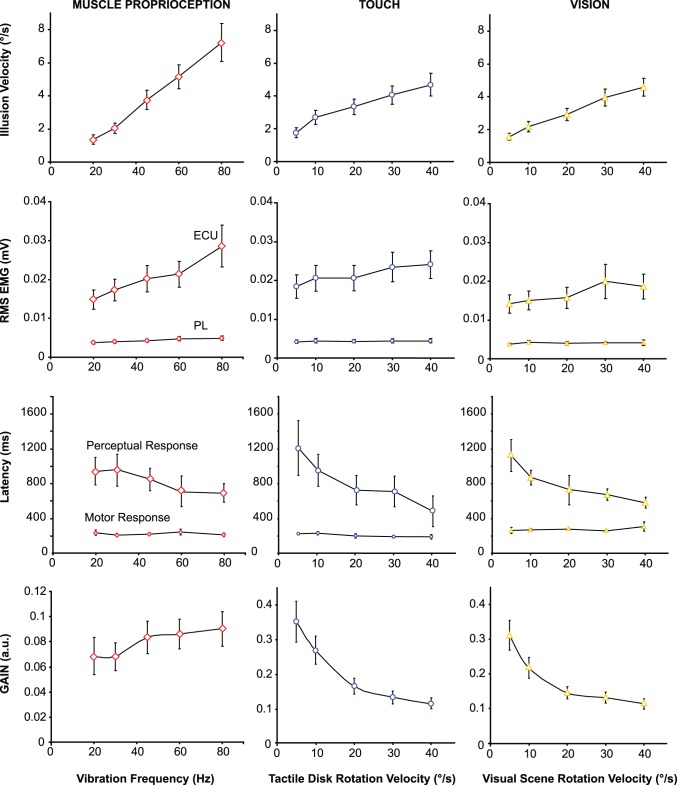
Figure 3. The effects of 5 levels of stimulation intensity on the perceptual and motor responses elicited by isolated proprioceptive (left column), tactile (central column) or visual (right column) stimulation.
From top to bottom: Mean velocities (± S.D.) of the kinaesthetic illusions reproduced by the participants; Mean RMS (± S.D.) of EMG activity in the right extensor carpi ulnaris (ECU) and pollicis longus (PL) muscles;- Mean latencies (± S.D.) of the motor and perceptual responses; Mean gains (a.u.) of the perceptual responses (± S.D.), i.e., the ratio between the illusion velocity and the stimulation intensity.

